Atlas login
Climate change is an urgent global crisis that affects us all. The devastating effects of climate change, from extreme weather events to rising sea levels, have prompted organizations and governments to seek innovative solutions. In response to this challenge, Kontur offers a suite of geospatial solutions that address preparedness, mitigation, emergency response, and climate change adaptation. This article explores how Kontur’s expertise can help combat climate change and its far-reaching consequences.
Understanding the Multifaceted Effects of Climate Change
Climate change is not a single issue but a complex web of interconnected problems. Climate change manifests as rising temperatures, shifting weather patterns, and increasingly frequent natural disasters.
As a result, organizations and governments are faced with the daunting task of finding ways to prevent climate change and adapt to its impacts. From heat waves and wildfires to climate migration and sea level rise, the effects of global climate change are far-reaching and require comprehensive solutions.
Kontur’s Climate Change Geospatial Solutions
Kontur is at the forefront of providing innovative solutions to tackle climate change. Our geospatial solutions are designed to address various aspects of this multifaceted challenge. We offer tools for preparedness, mitigation, emergency response, and climate change adaptation.
What sets us apart, however, is our commitment to custom solutions tailored to the unique needs of our clients. We deeply understand the complexities of climate change and stand ready to develop bespoke Geographic Information System (GIS) solutions.
Dataset Catalog
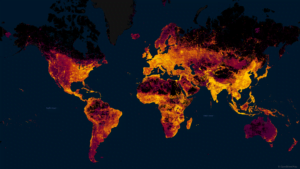
One of the critical challenges that climate change researchers face is the lack of homogeneous and consistent data for analysis. To address this issue, Kontur has curated a catalog of global data represented in hexagons. This dataset catalog comprises vital metrics on demographics, environmental features, hazards, and infrastructure.
Notably, in collaboration with Probable Future, we have created a dataset that illustrates what the world might look like at different levels of warming. This includes scenarios such as:
- Days with temperatures exceeding 32°C and nights with temperatures over 25°C under a potential climate warming scenario of +1°C.
- Days with temperatures exceeding 32°C and nights with temperatures over 25°C under a potential climate warming scenario of +2°C.
- Days with temperatures exceeding 32°C, factoring in humidity, for different potential climate warming scenarios.
Data Processing
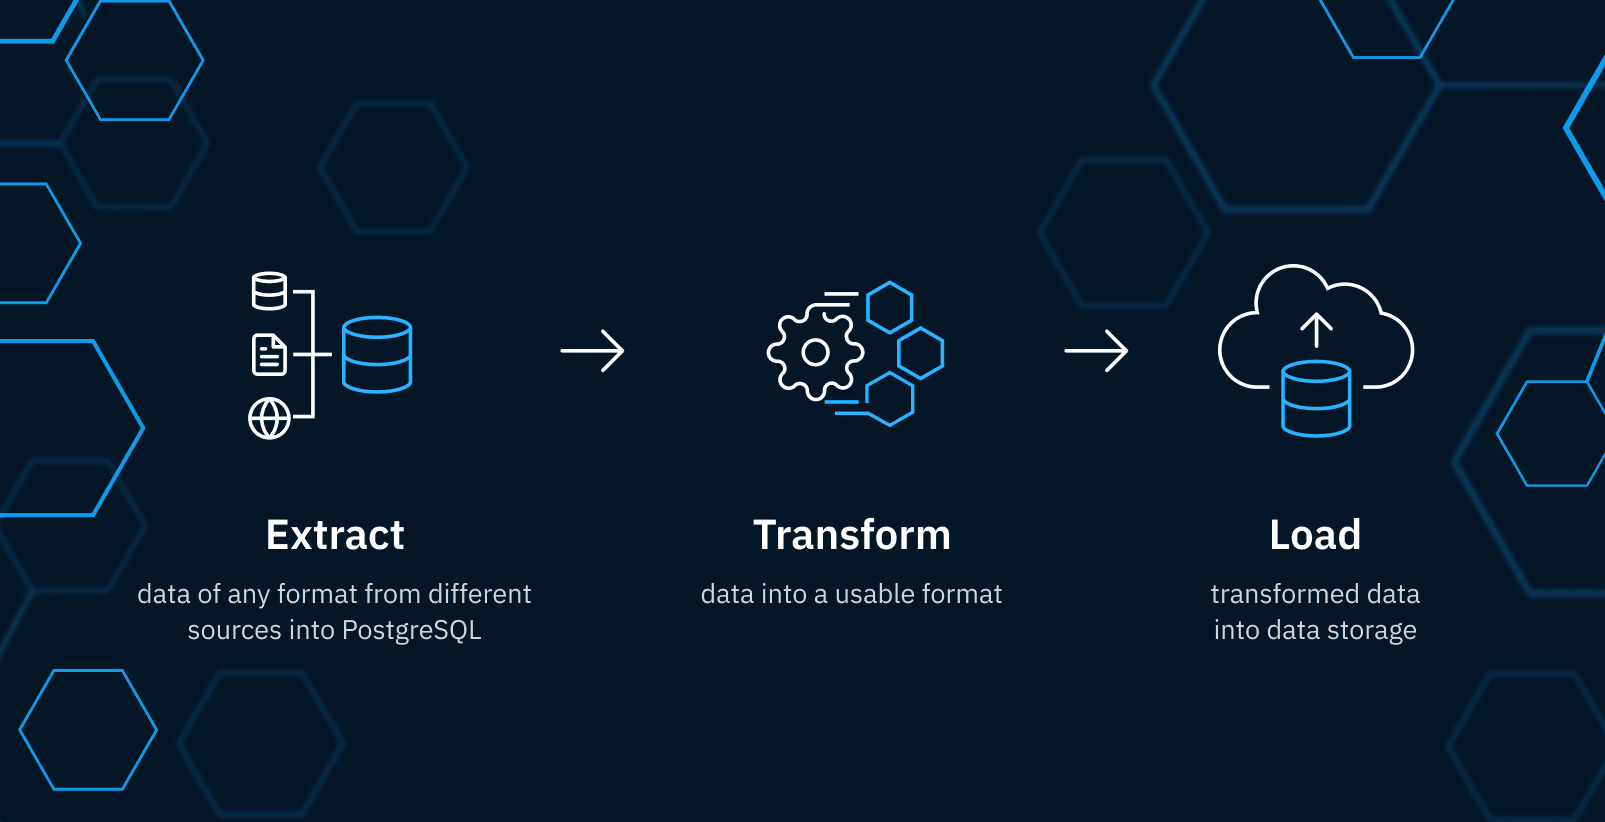
Climate change research faces significant challenges related to data accessibility and the diversity of data sources. To tackle these issues, we present the Geocint pipeline, specifically designed to extract, transform, and load large volumes of diverse spatial data. The Geocint Pipeline has demonstrated its reliability through years of rigorous in-house use and offers several key advantages::
- Open-source under the MIT license.
- Capable of processing big data.
- Easy to maintain.
- Delivers high performance on single nodes.
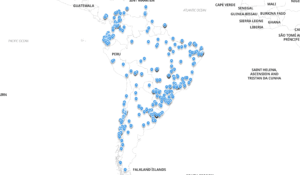
Global Natural Disaster Feed
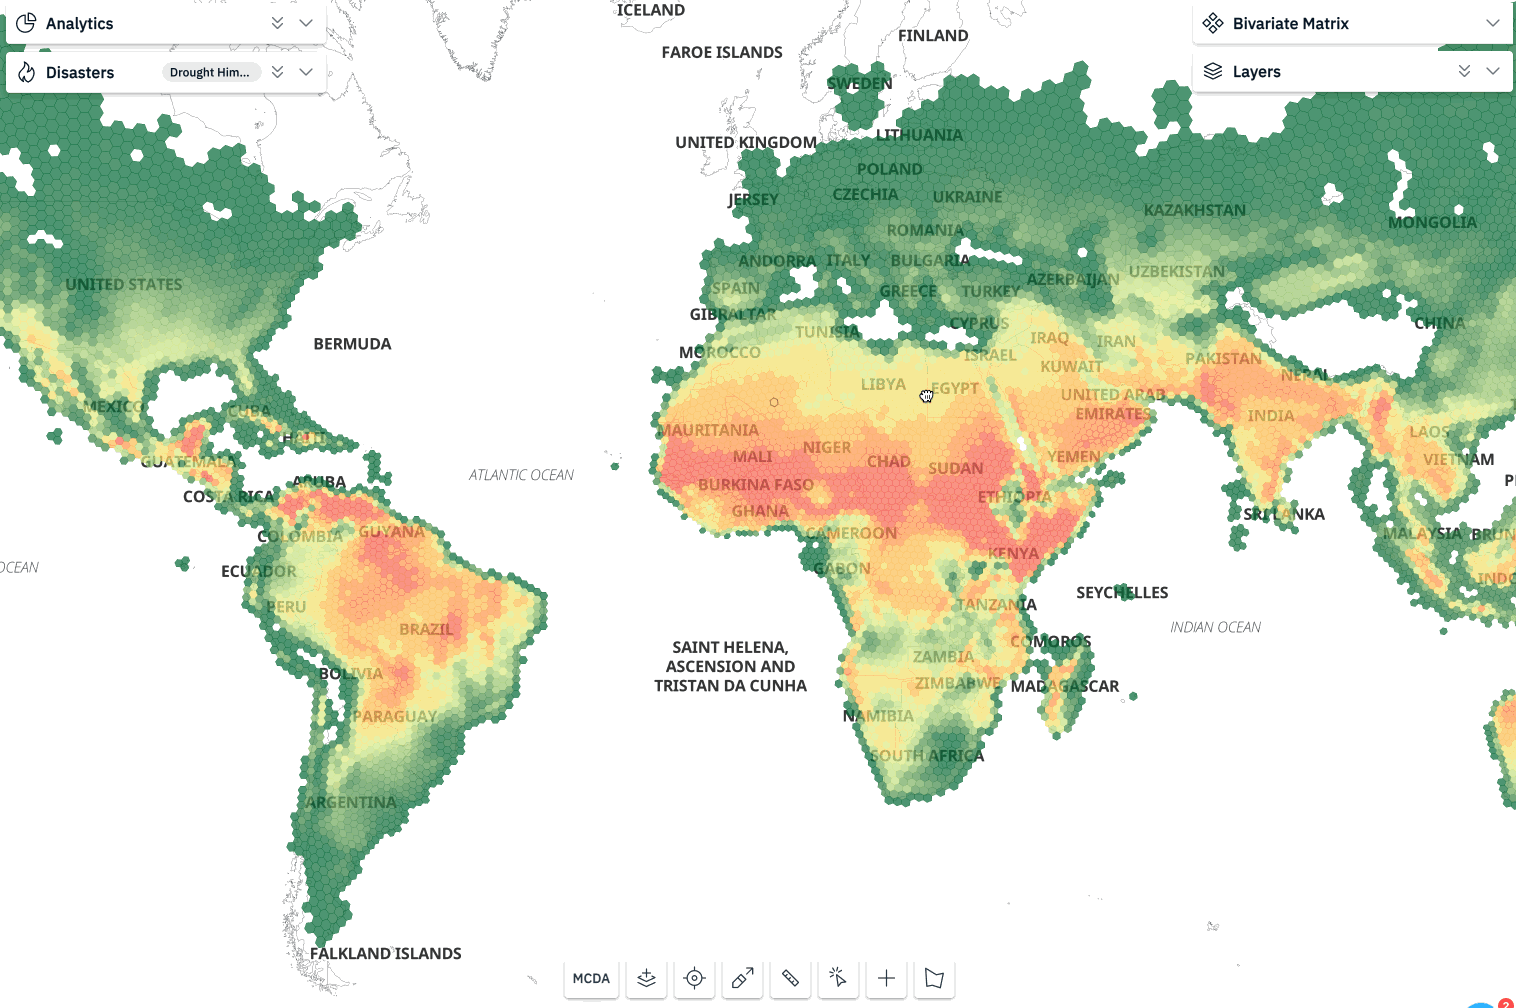
Event Feed visualisation with Natural Disaster list and map
Kontur provides real-time access to a comprehensive feed of natural disasters. This feed aggregates data from reputable sources and unifies it for analysis, pattern recognition, timely response, and informed decision-making.
Data Analysis and Visualisation
Data Analysis
Kontur’s data analysis solutions offer a variety of tools to help businesses and organizations understand and mitigate the impacts of climate change. These solutions enable seamless integration and analysis of disparate datasets.
They can be used to assess the vulnerability of different regions to climate change impacts, including heat waves, wildfires, sea level rise, and climate migration. This valuable information can help develop early warning systems, allocate resources effectively, and protect vulnerable populations.
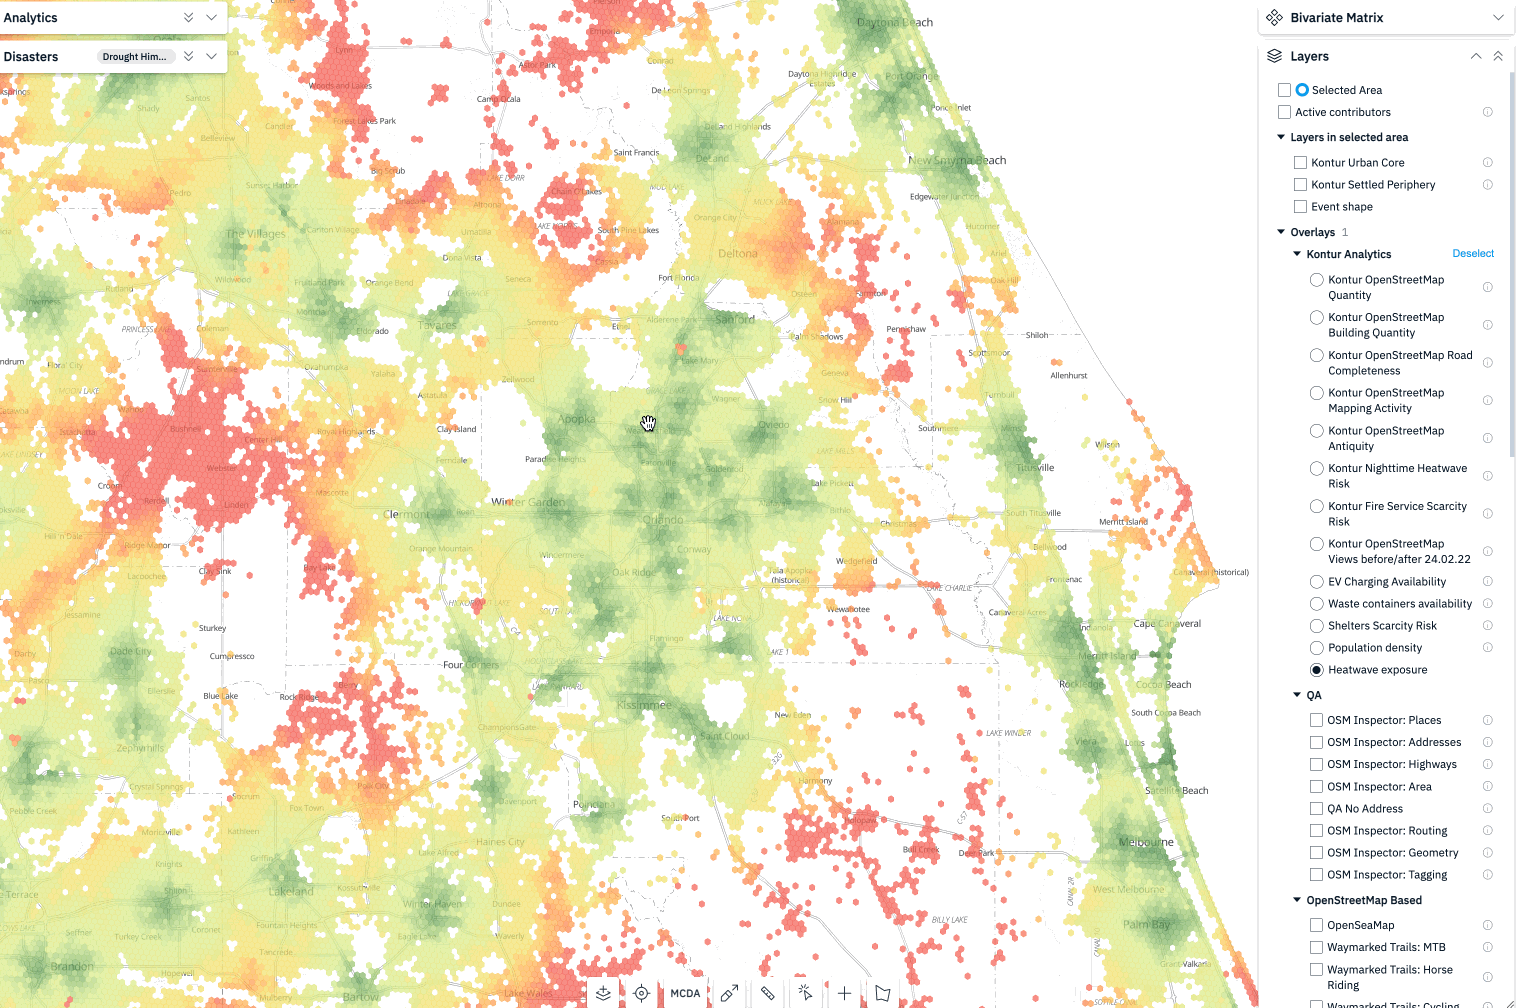
Data Visualization for Climate Change Analysis
Data visualization is a powerful tool for communicating complex climate change data to a wide range of audiences. By using charts, graphs, and maps to present data in a clear and concise way, data visualization can help to raise awareness of climate change, inform decision-making, and promote action.
Kontur’s data visualization tools can be used to create a variety of climate change-related visualizations, including:
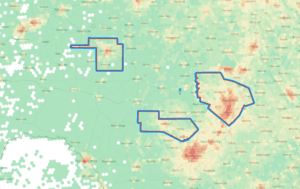
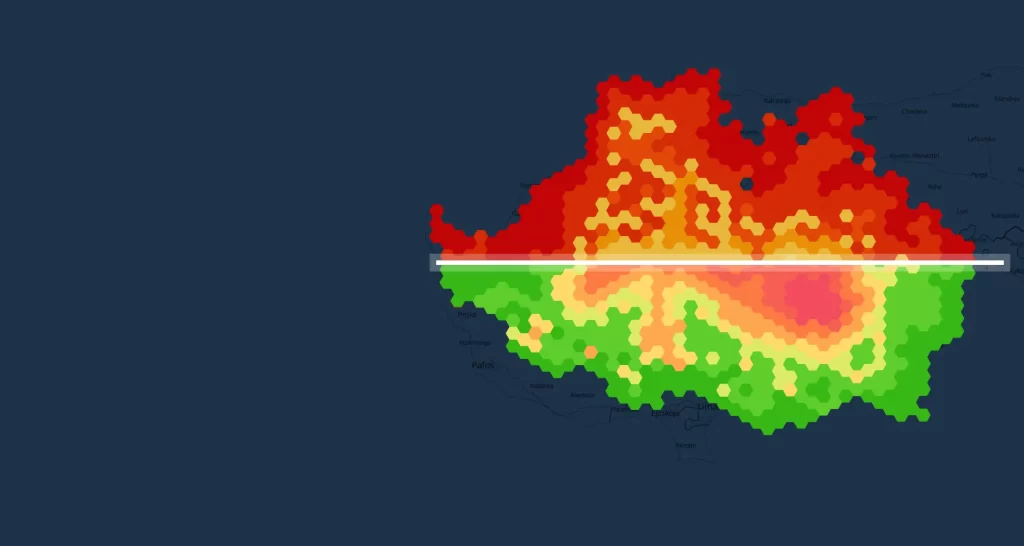
- Hexagonal maps: type of thematic map that uses hexagons to represent data. Hexagons are a good choice for thematic maps because they are closely packed and fill space efficiently, without leaving any gaps. This makes them ideal for representing data that is distributed over a large area.
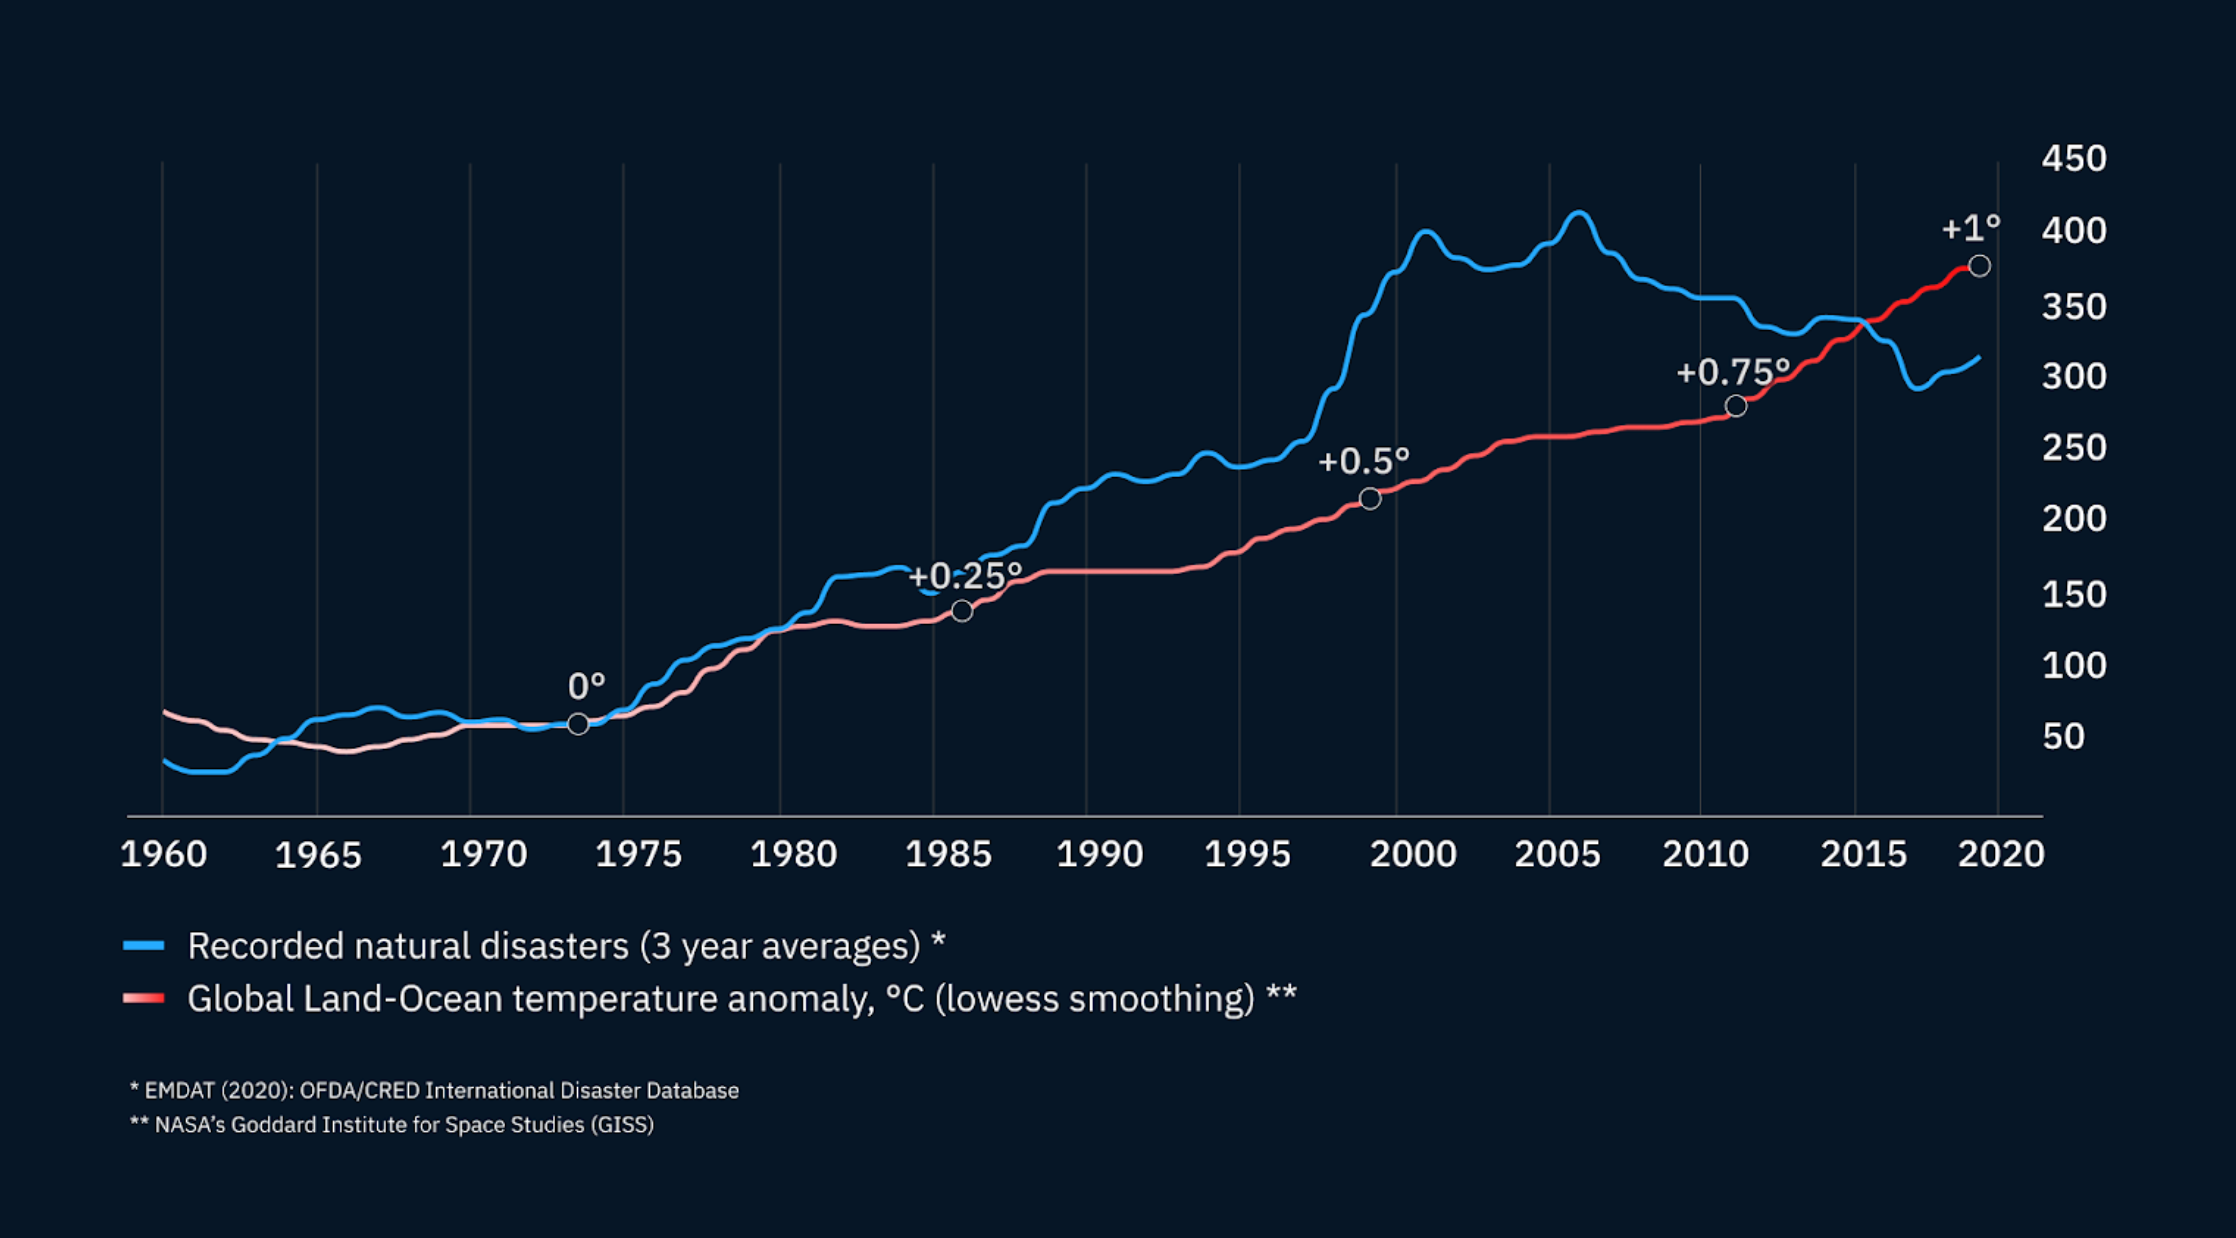
- Time series charts: Time series charts can be used to show how climate change impacts are changing over time. This can help to identify trends and to project future impacts.
- Heat maps: Heat maps can be used to show the spatial distribution of climate change impacts, such as heat waves, wildfires, and sea level rise. This can help to identify areas that are most at risk and to develop targeted adaptation strategies.
Incident Command Systems for Climate-Induced Crises
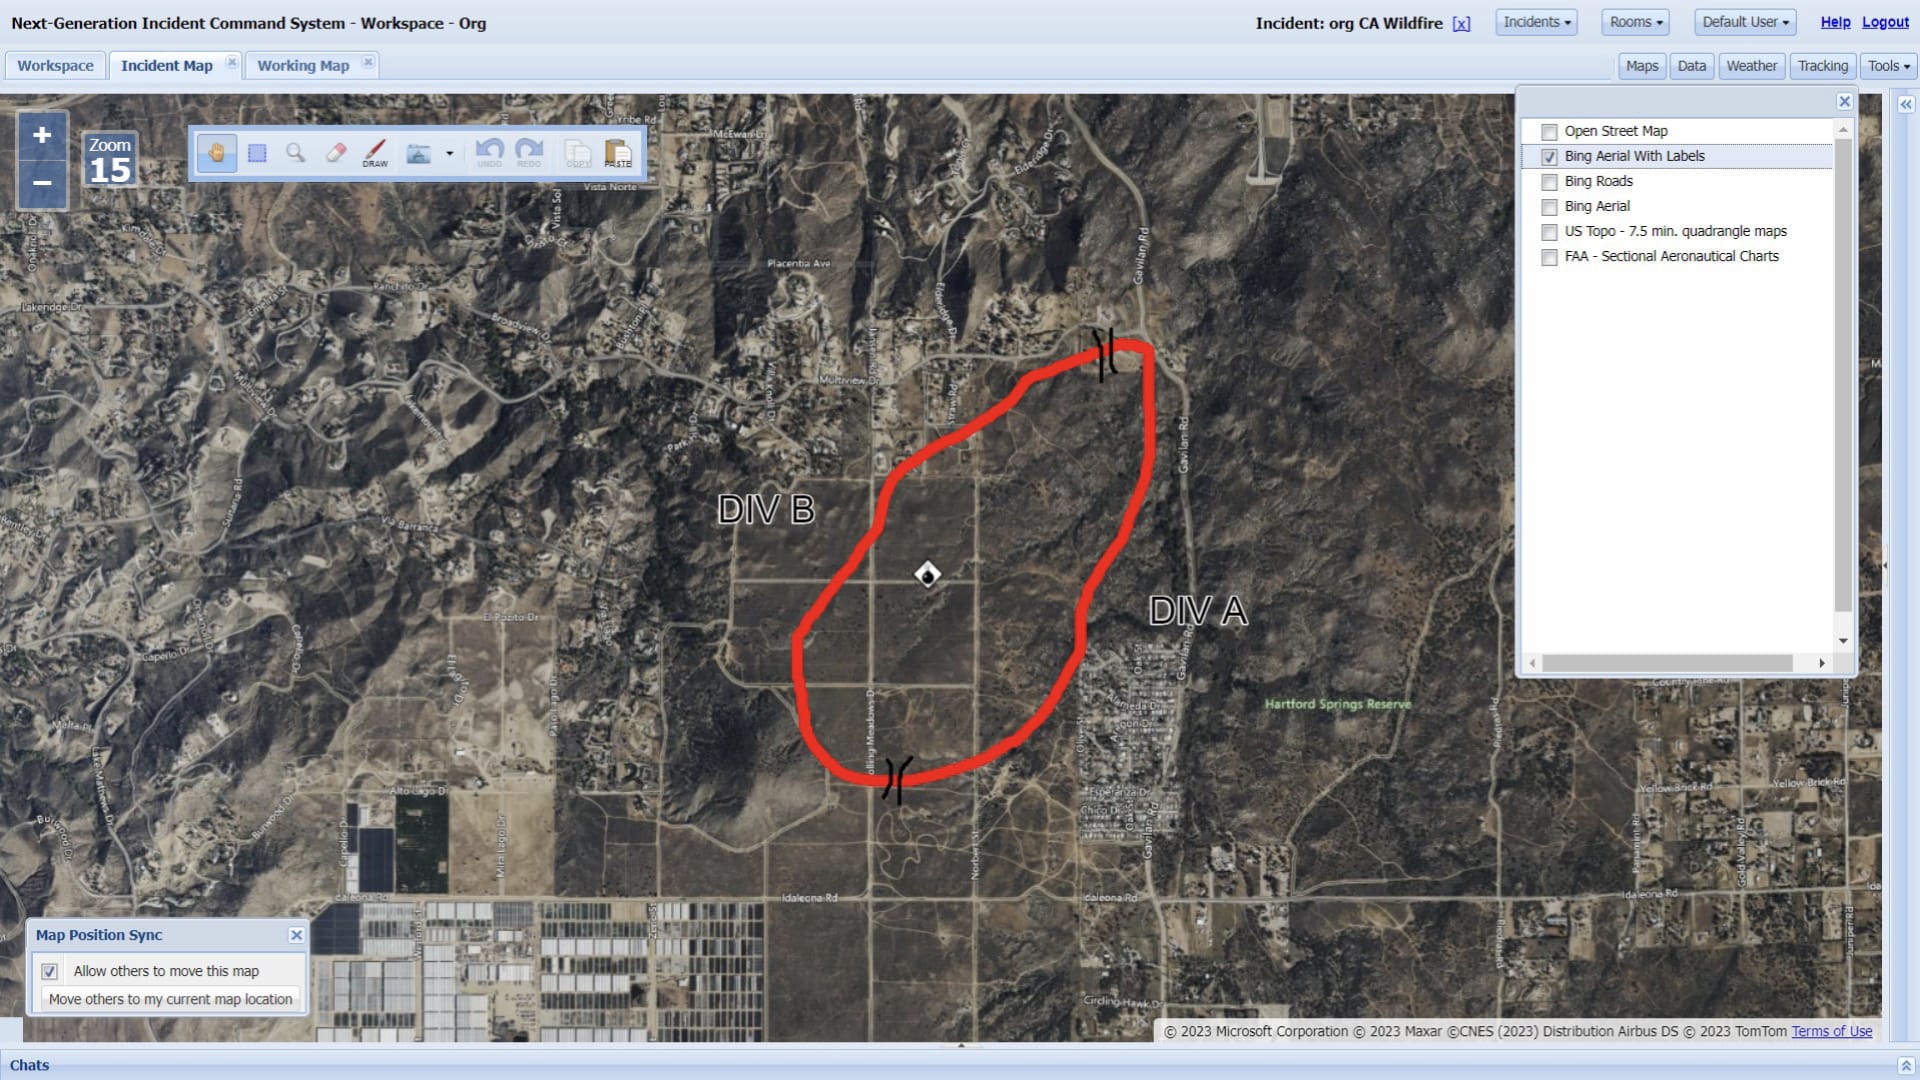
Incident Command Systems (ICS) play a pivotal role in managing climate-induced crises. They facilitate coordination, communication, and rapid decision-making by processing vast geospatial data, enabling quick responses to unfolding crises. Kontur employs cutting-edge ICS to overcome climate change challenges. These systems analyze location-based data, allowing organizations to formulate data-driven responses to climate emergencies. As geospatial decision-making becomes central to climate change mitigation and adaptation, the role of ICS systems is more crucial than ever.
Conclusion
In the face of global climate change and its far-reaching consequences, the need for effective solutions has never been greater. Kontur’s climate change geospatial solutions, data catalogs, and incident command systems offer essential tools for addressing this urgent challenge.