Atlas login

What is Climate Change Analysis?
Climate change analysis is the process of understanding and predicting the impacts of climate change. This can be done by combining data from a variety of sources, including satellite imagery, weather stations, and ground-based observations.
Why is Climate Change Analysis Important?
Climate change is one of the most pressing challenges facing humanity today. It is already having a significant impact on our planet, and its effects are only expected to worsen in the coming years. Climate change analysis can help us to understand and prepare for the impacts of climate change to mitigate its effects and adapt to its consequences.
How Does Kontur’s Approach to Climate Change Analysis Work?
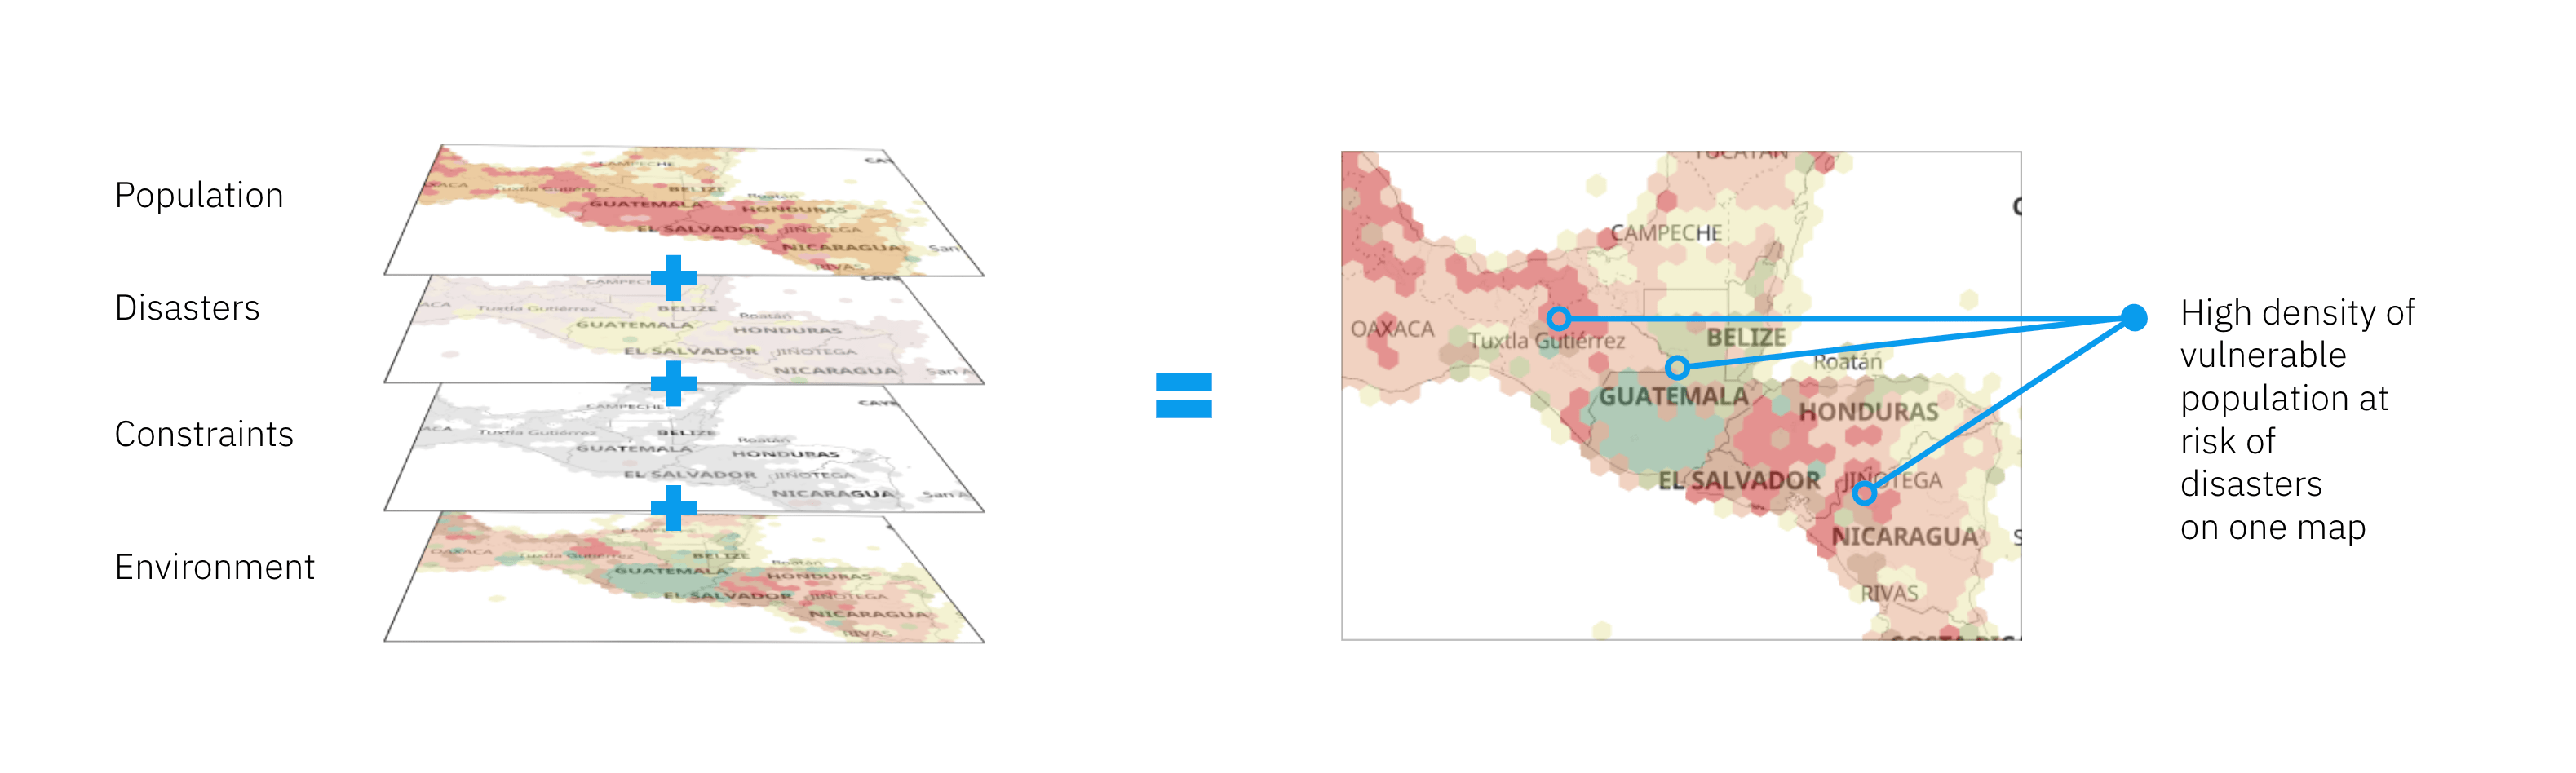
Kontur offers a new approach to climate change analysis using spatial data layers. This approach allows users to combine and analyze data from a variety of sources to create a comprehensive picture of climate change impacts at the local, regional, and global scales.
Benefits of Approach that Kontur uses
Approach that Kontur uses to climate change analysis has a number of benefits:
Rich calculations functionality
Kontur provides advanced calculation mechanics for in-depth climate change analysis.
Streamlined Data Visualization
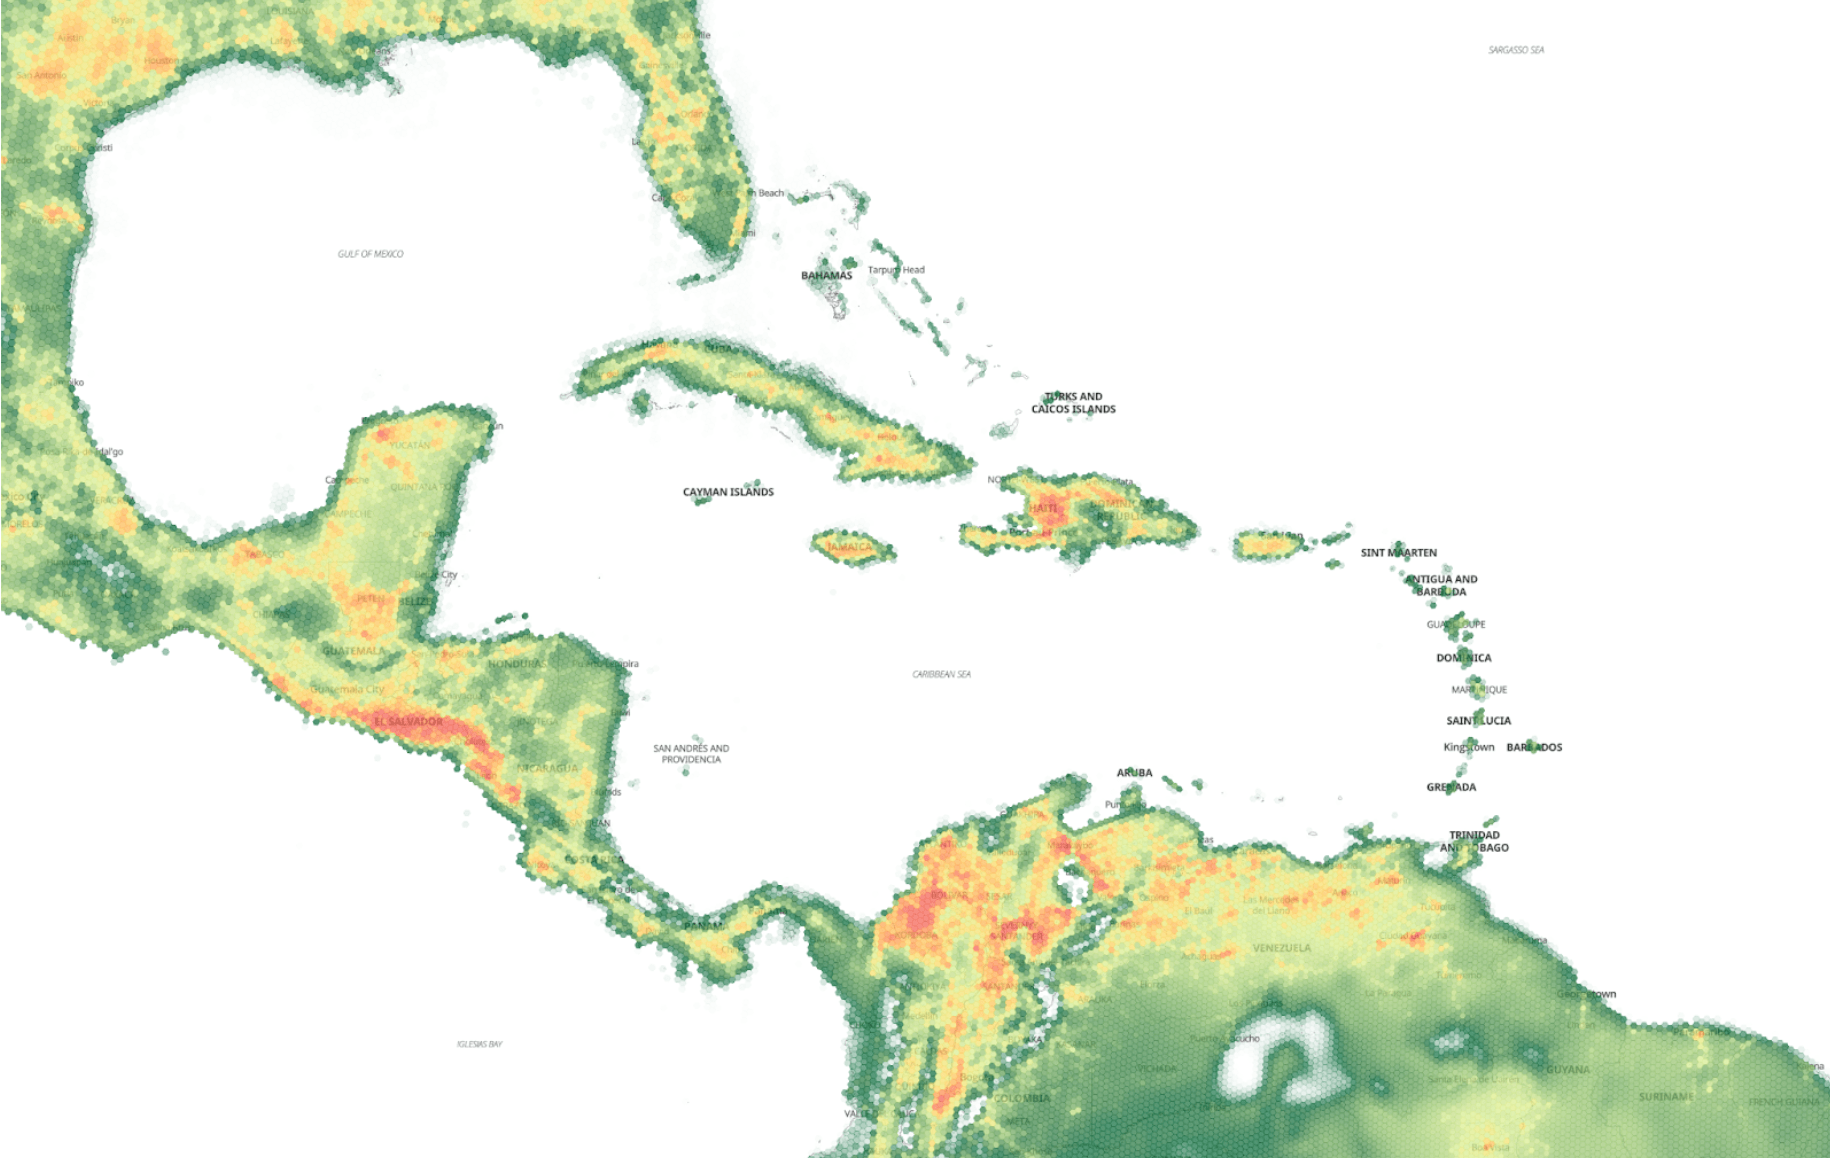
Kontur’s platform features interactive hexagonal maps with a timeline, ensuring comprehensive coverage for all analysis aspects.
Highly scalable
It is highly scalable and can be used to analyze climate change impacts at the local, regional, and global scales.
Real-time data support
Kontur incorporates real-time sensor data and existing disaster models in its analysis, enhancing the accuracy and timeliness of climate-related information.
Combine data
It allows users to combine data from a variety of sources, providing a more complete and accurate picture of climate change impacts.
Let’s explore how Kontur’s analysis addresses specific aspects of climate change:
Heat Wave Risks
Rising temperatures, a clear sign of global climate change, have widespread effects. They exacerbate droughts, increase energy consumption, hinder food production, and pose health risks.
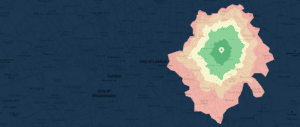
Climate change map: Days above 32°C (+2°C scenario)

Kontur has partnered with Probable Future to create datasets that illustrate the world’s potential conditions at different levels of warming. For instance, a 2°C increase in temperature can drastically change heatwave patterns.
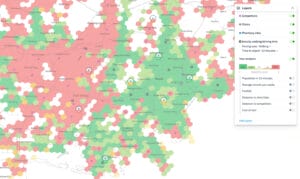
Climate change analysis map: Heat wave impact to vulnerable population
Utilizing our analysis, Kontur highlights vulnerable populations at risk of heatwaves. Governments can better prepare for heatwave-related challenges by analyzing factors such as:
- number of days with temperatures above 32°C,
- population over 65 years old
- proximity to hospitals
Climate Migration
This analysis also helps identify areas susceptible to climate-induced migration. By considering factors like the number of days with minimum temperatures above 25°C and population density, Kontur assists in administrative planning to reduce the risk of climate migration and expedite local community adaptation.
Climate Change Wildfires Analysis
Wildfires have become increasingly frequent and devastating due to climate change. They result in loss of life and property, carbon emissions, air quality deterioration, ecosystem damage, and water quality issues.
To assess the probability of forest fires Kontur’s analysis incorporates various factors like:
- Land Cover: Forest
- Wildfires data for the last 7 days from satellites
- Max air temperature
- Drought days count
Real-time sensor data integration and existing disaster models further enhance wildfire analysis.
Sea Level Rise
Sea level rise is a pressing issue for coastal communities worldwide. The simulation shows vast coastal areas submerged due to a 70-meter sea level rise, displacing millions of people and causing irreplaceable losses in cultural and natural heritage.
While it’s important to note that such a scenario is extreme and highly unlikely in the foreseeable future.
Here is a list of some major coastal cities that would be severely affected by such a dramatic sea level rise:
- New York City, USA
- Miami, USA
- Shanghai, China
- Mumbai, India
- Tokyo, Japan
- London, United Kingdom
- Rio de Janeiro, Brazil
- Sydney, Australia
- Amsterdam, Netherlands
- Venice, Italy
- Bangkok, Thailand
- Jakarta, Indonesia
- Lagos, Nigeria
- Manila, Philippines
- Dhaka, Bangladesh
- Ho Chi Minh City, Vietnam
- Alexandria, Egypt
- New Orleans, USA
Sea Level Rise Population Exposure Analysis
Kontur’s analysis goes beyond the simulation to pinpoint critical areas that would be affected in the event of significant sea level rise. By considering factors such as estimated sea level rise, elevation, and population density, the analysis identifies regions where the human impact would be most severe. This information is invaluable for governments, communities, and organizations in preparing for the potential displacement of populations, the protection of critical infrastructure, and the development of evacuation plans.
Conclusion
These are just a few examples of the capabilities Kontur provides to address the challenges of analyzing climate change. With expertise in data processing, analysis, and visualization, Kontur equips governments, organizations, and communities with the tools they need to mitigate and adapt to climate change, building a sustainable future.