Atlas login

What it is
Disaster Ninja is a critical event management solution that provides information about recent natural disasters, visualizes mapping gaps, and helps you connect with locals for ground truth verification.
While you cannot map new objects in Disaster Ninja directly, the tool enables humanitarian organizations to prepare and prioritize new tasks for subsequent mapping rapidly. Swift and reliable decisions about when and where to start mapping can save precious time for disaster response during a crisis.
Why we made it
We believe everyone should have access to better maps, which led us to direct our efforts and contribution to the free, community-driven OpenStreetMap. Our partnership with Humanitarian OpenStreetMap Team (HOT) has proven that having reliable location data is critical in disaster management. By enhancing OpenStreetMap data, we aim to support disaster response efforts and ultimately help save people’s lives.
Even though we specifically designed Disaster Ninja for humanitarian mappers, the tool’s functionality is broader nowadays: you can get analytics for any area of interest, load your geometries to retrieve insights, and much more. You can even use Disaster Ninja as a digital atlas for your personal needs.
How it helps
Event profiles
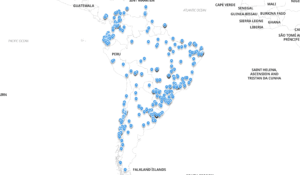
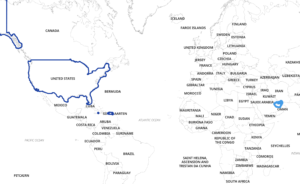
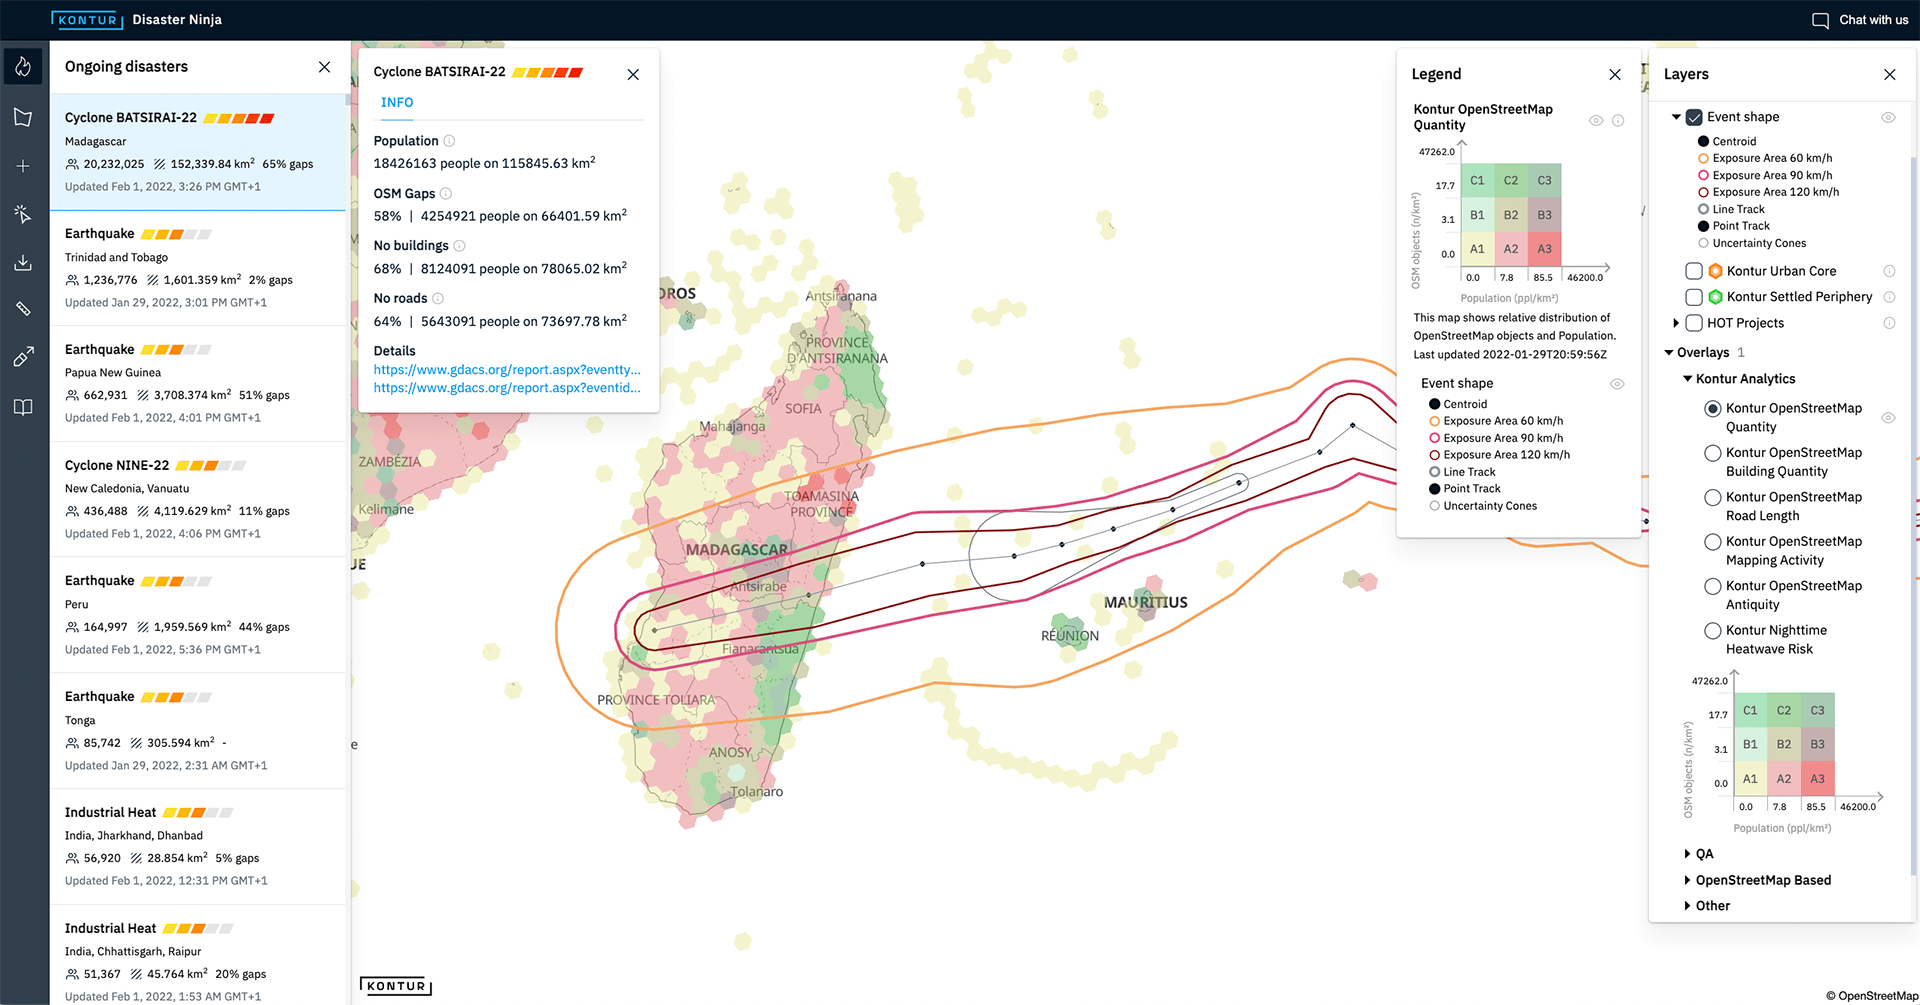
Disaster Ninja features a list of ongoing disasters from the Kontur Event Feed sorted by the population exposed. You can get a sense of events’ type, location, severity, area, and gaps in mapping coverage right away. An event shape and a corresponding legend describe each disaster type. The feed can be connected to an organization’s internal communication systems and tailored for specific user needs to alert relevant stakeholders about new disasters.
Event mapping support
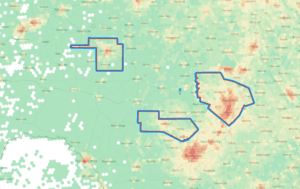
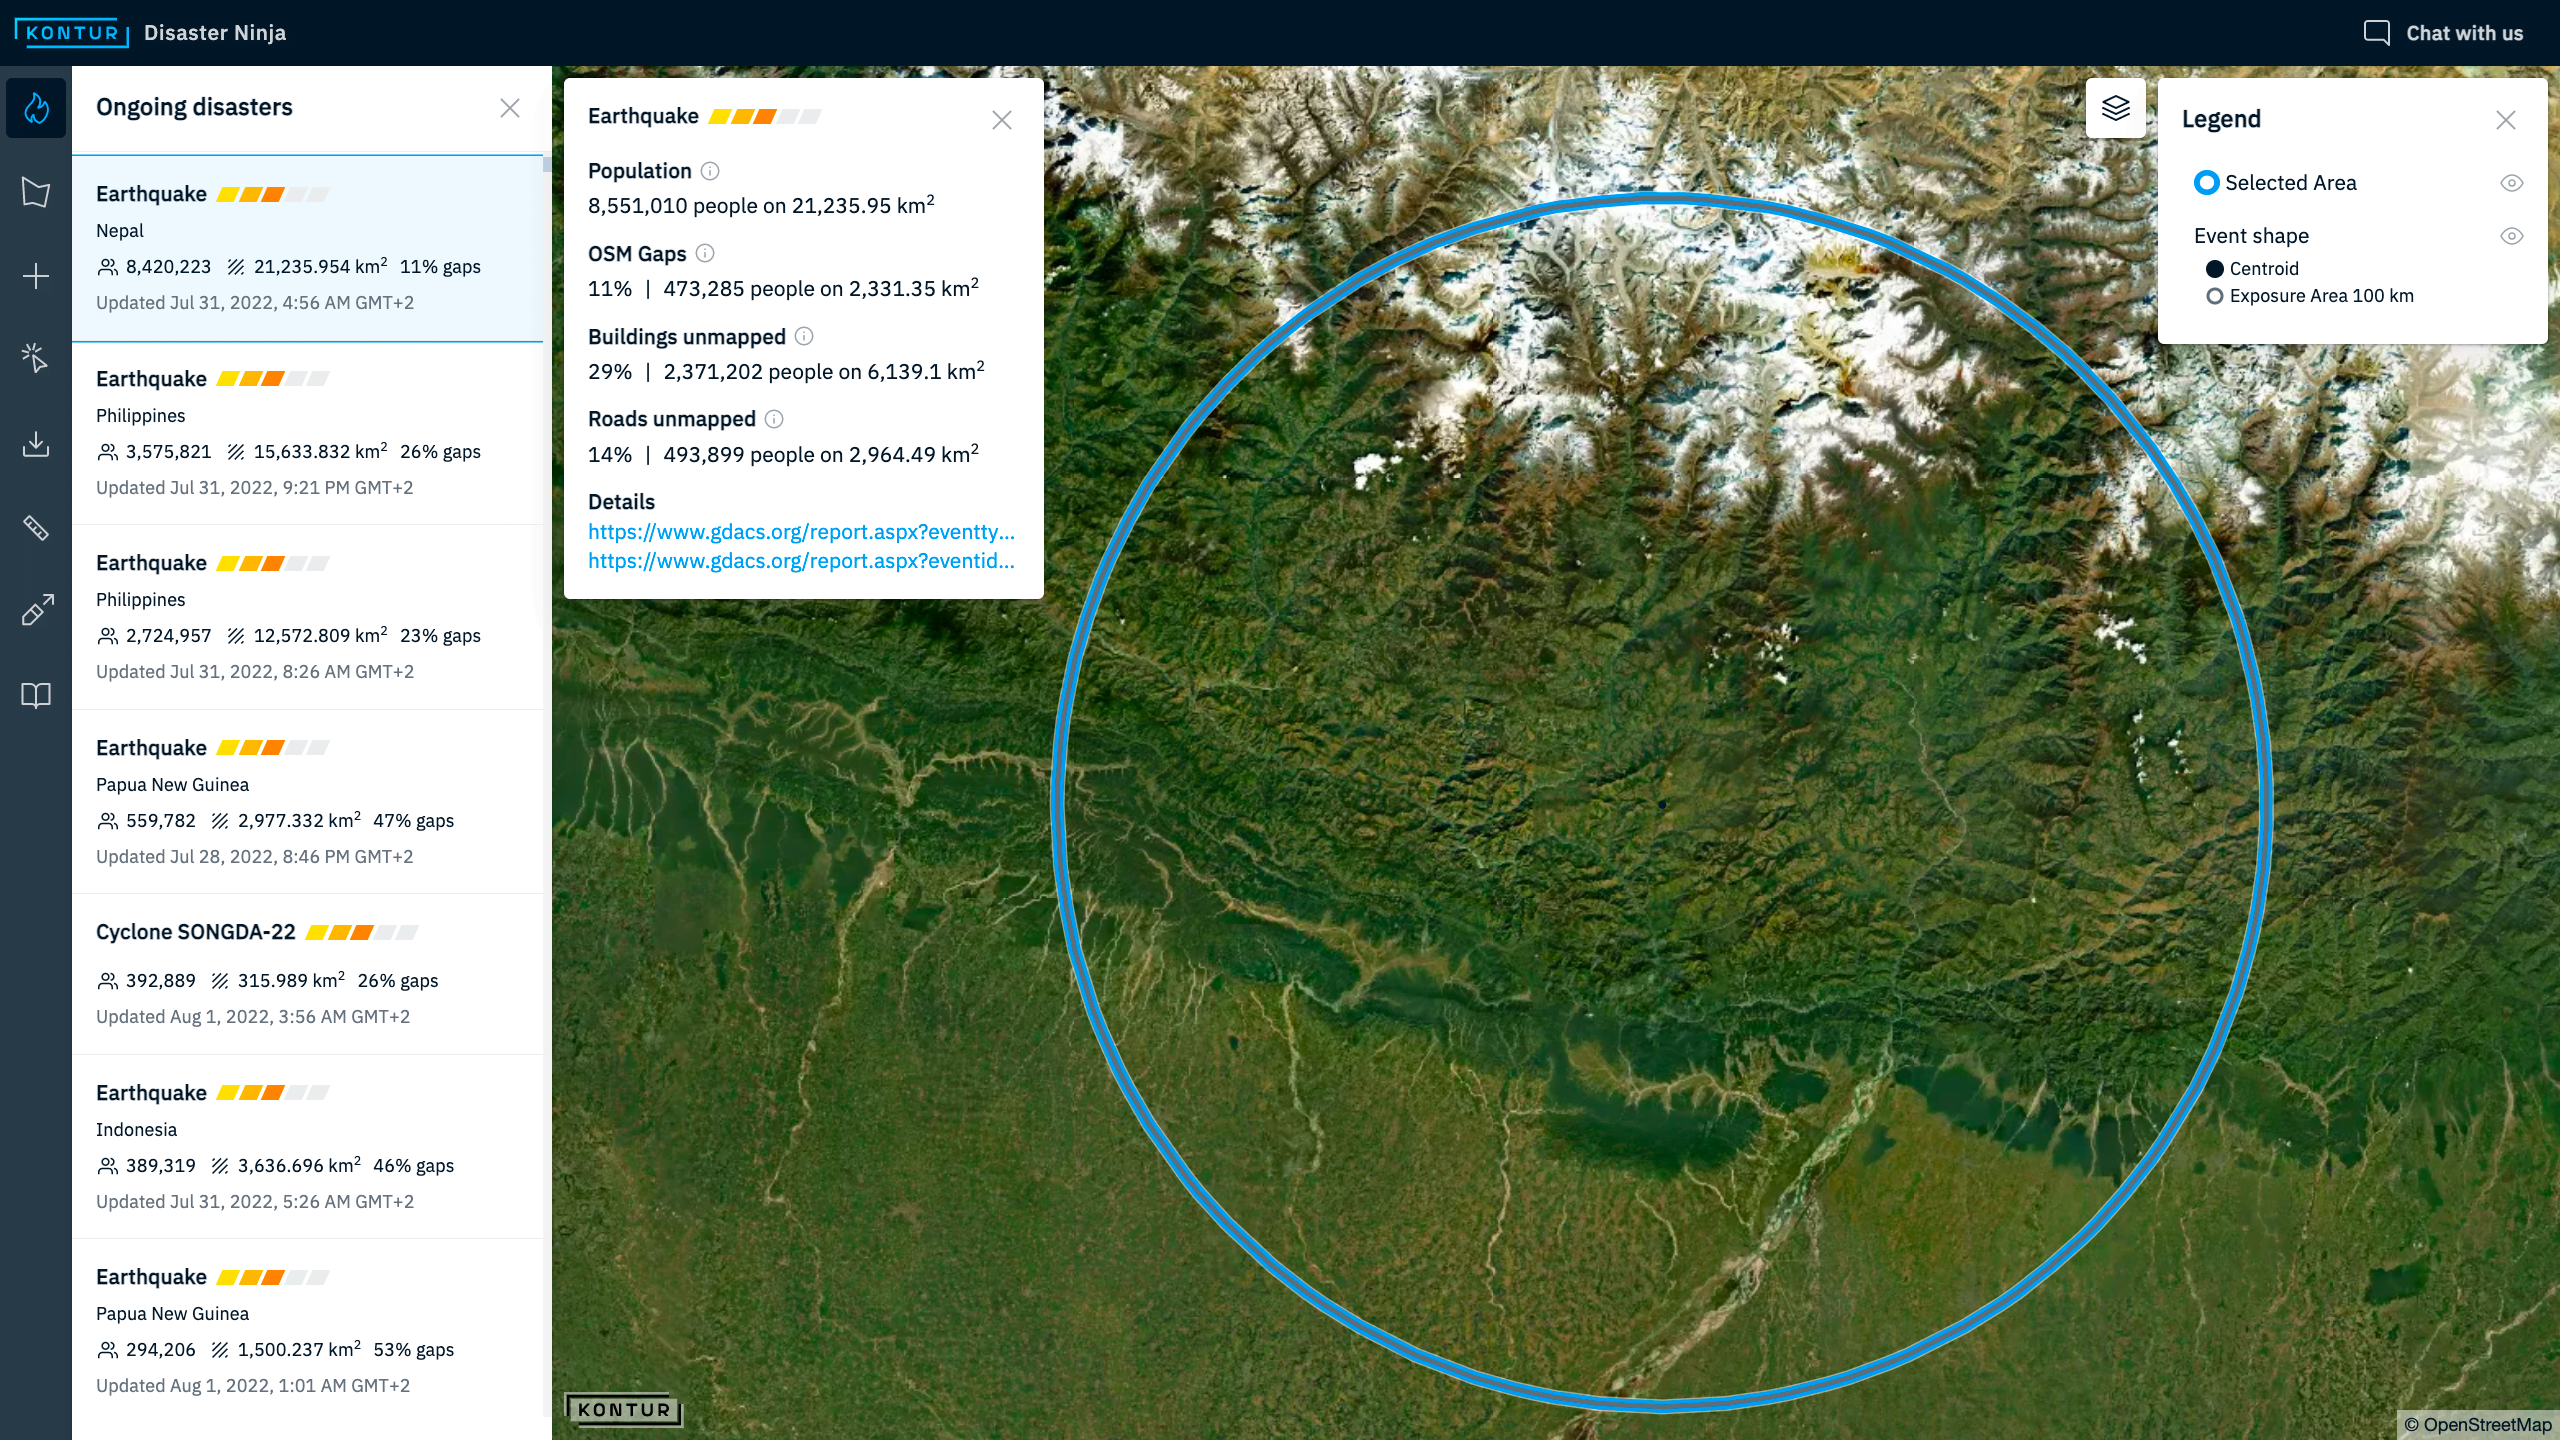
When a disaster strikes, better maps enable better response. During an early stage of an emergency event, humanitarian organizations face challenges such as specifying the area that needs to be mapped as quickly and accurately as possible and picking the datasets that would serve as a basis for volunteers’ mapping efforts. Disaster Ninja helps save time by presenting the event’s details and all available datasets in a concise visual form.
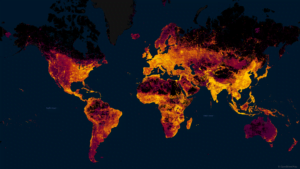
One such critical dataset is Kontur Population. We created it as a fundamental part of Disaster Ninja to enable confident decision making based on specific data visualized against population density. High-quality population data allows response coordinators to rapidly assess the affected area, ignore unpopulated places and focus on those with local communities exposed to the disaster.
As a result, Disaster Ninja often allows emergency cartographers to prepare mapping tasks in minutes instead of hours.
Data insights
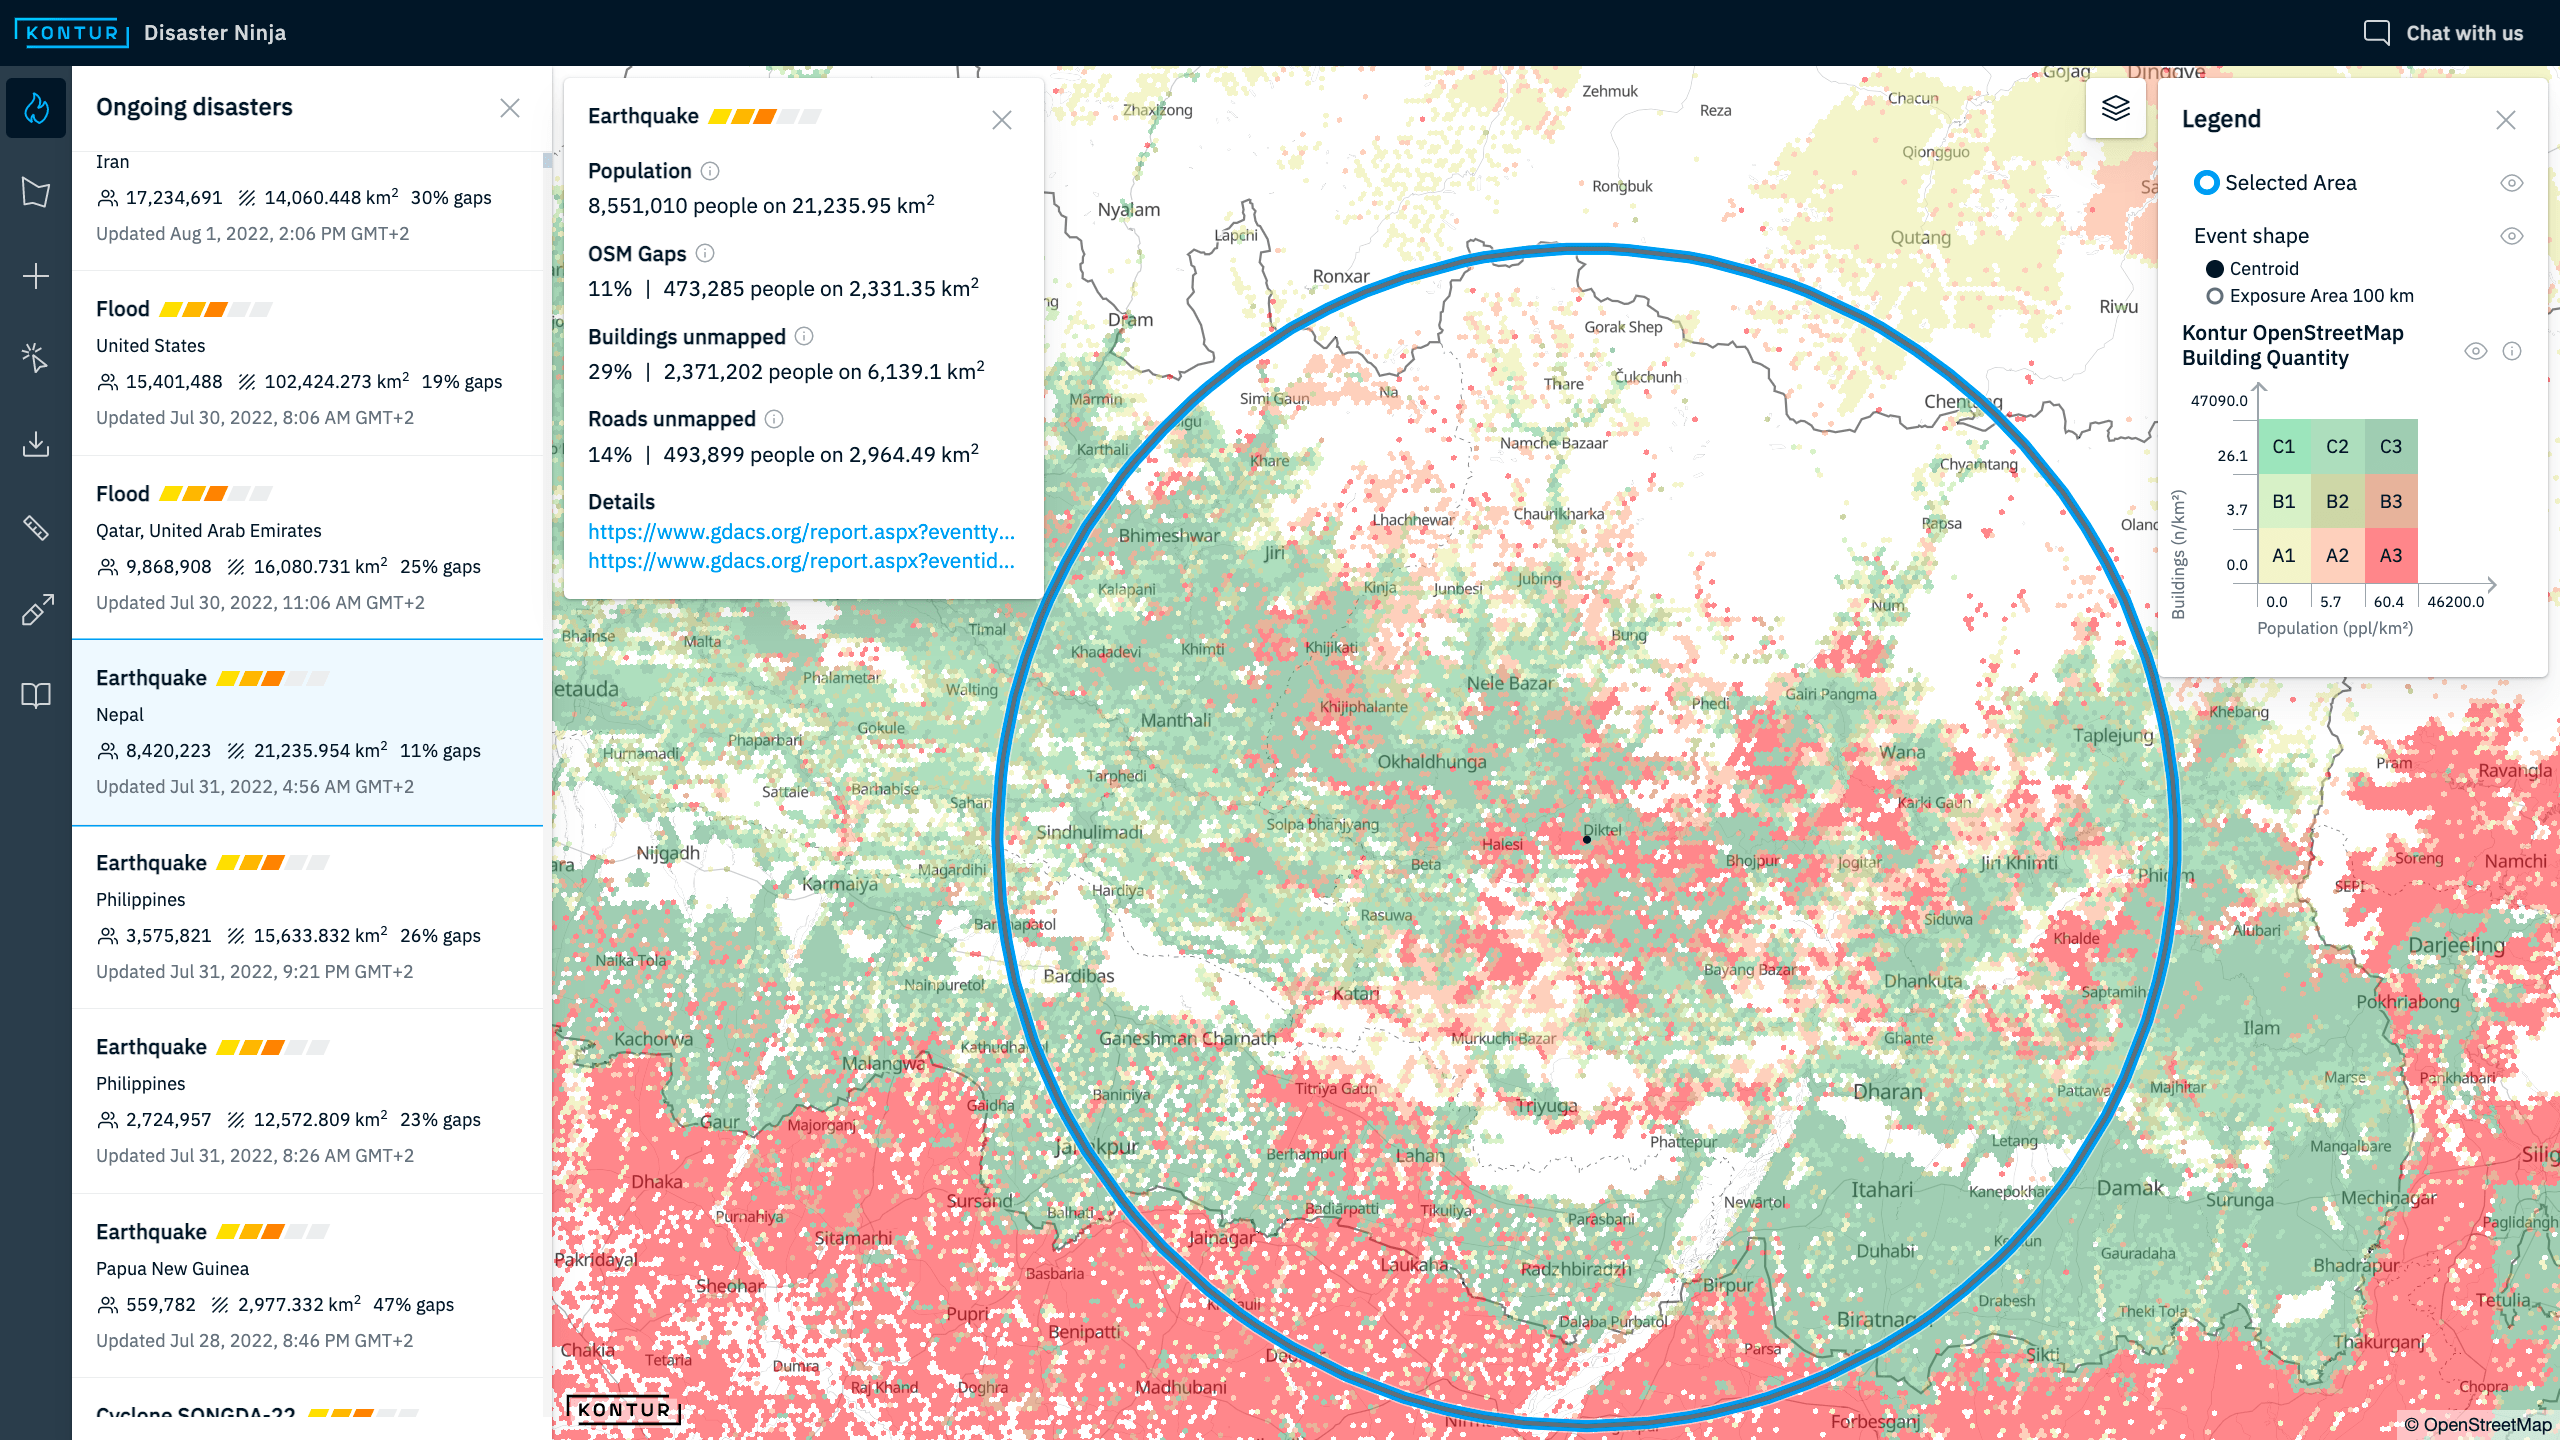
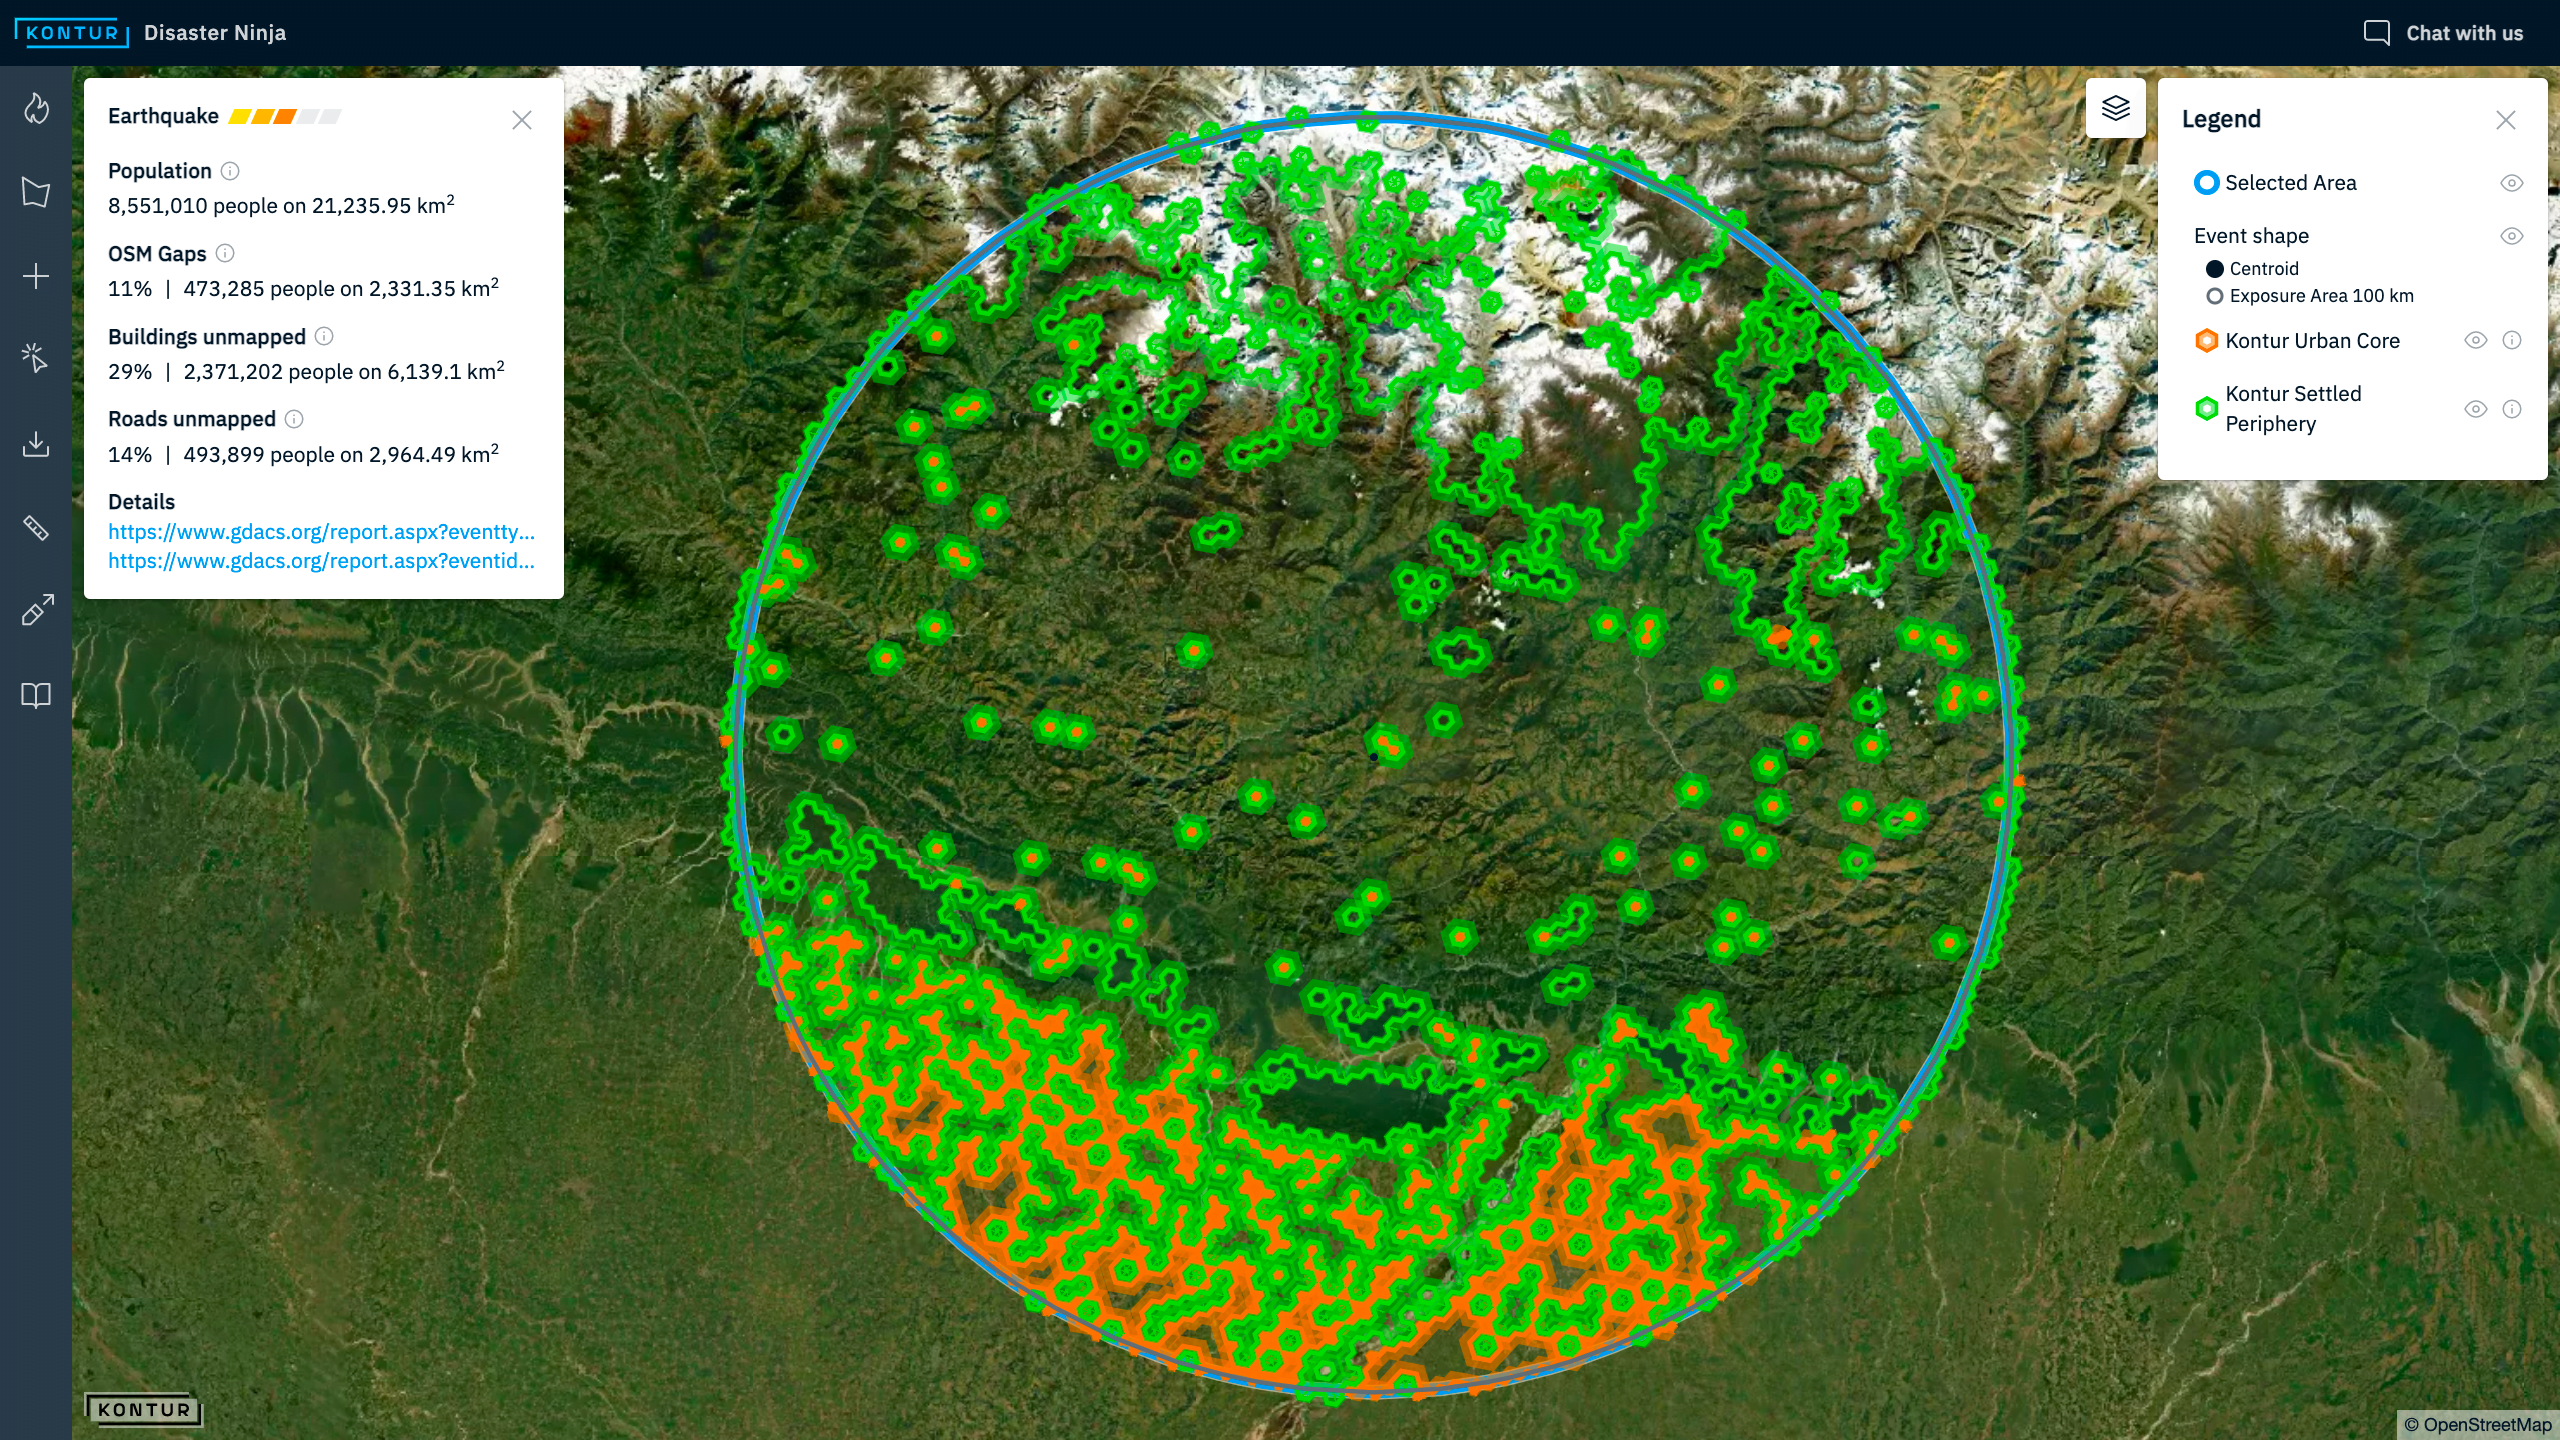
Our team creates analytical layers to help our clients and partners get relevant insights. In Disaster Ninja, we use the bivariate layers engine to visually explore the relationship between map data and population density on a single map. Here are just some examples of the insights you can gain:
- Highlight the most populated areas. These are typically urban areas with the highest population density, giving them higher priority in humanitarian activities during a disaster. (Made possible with Kontur Urban Core layer)
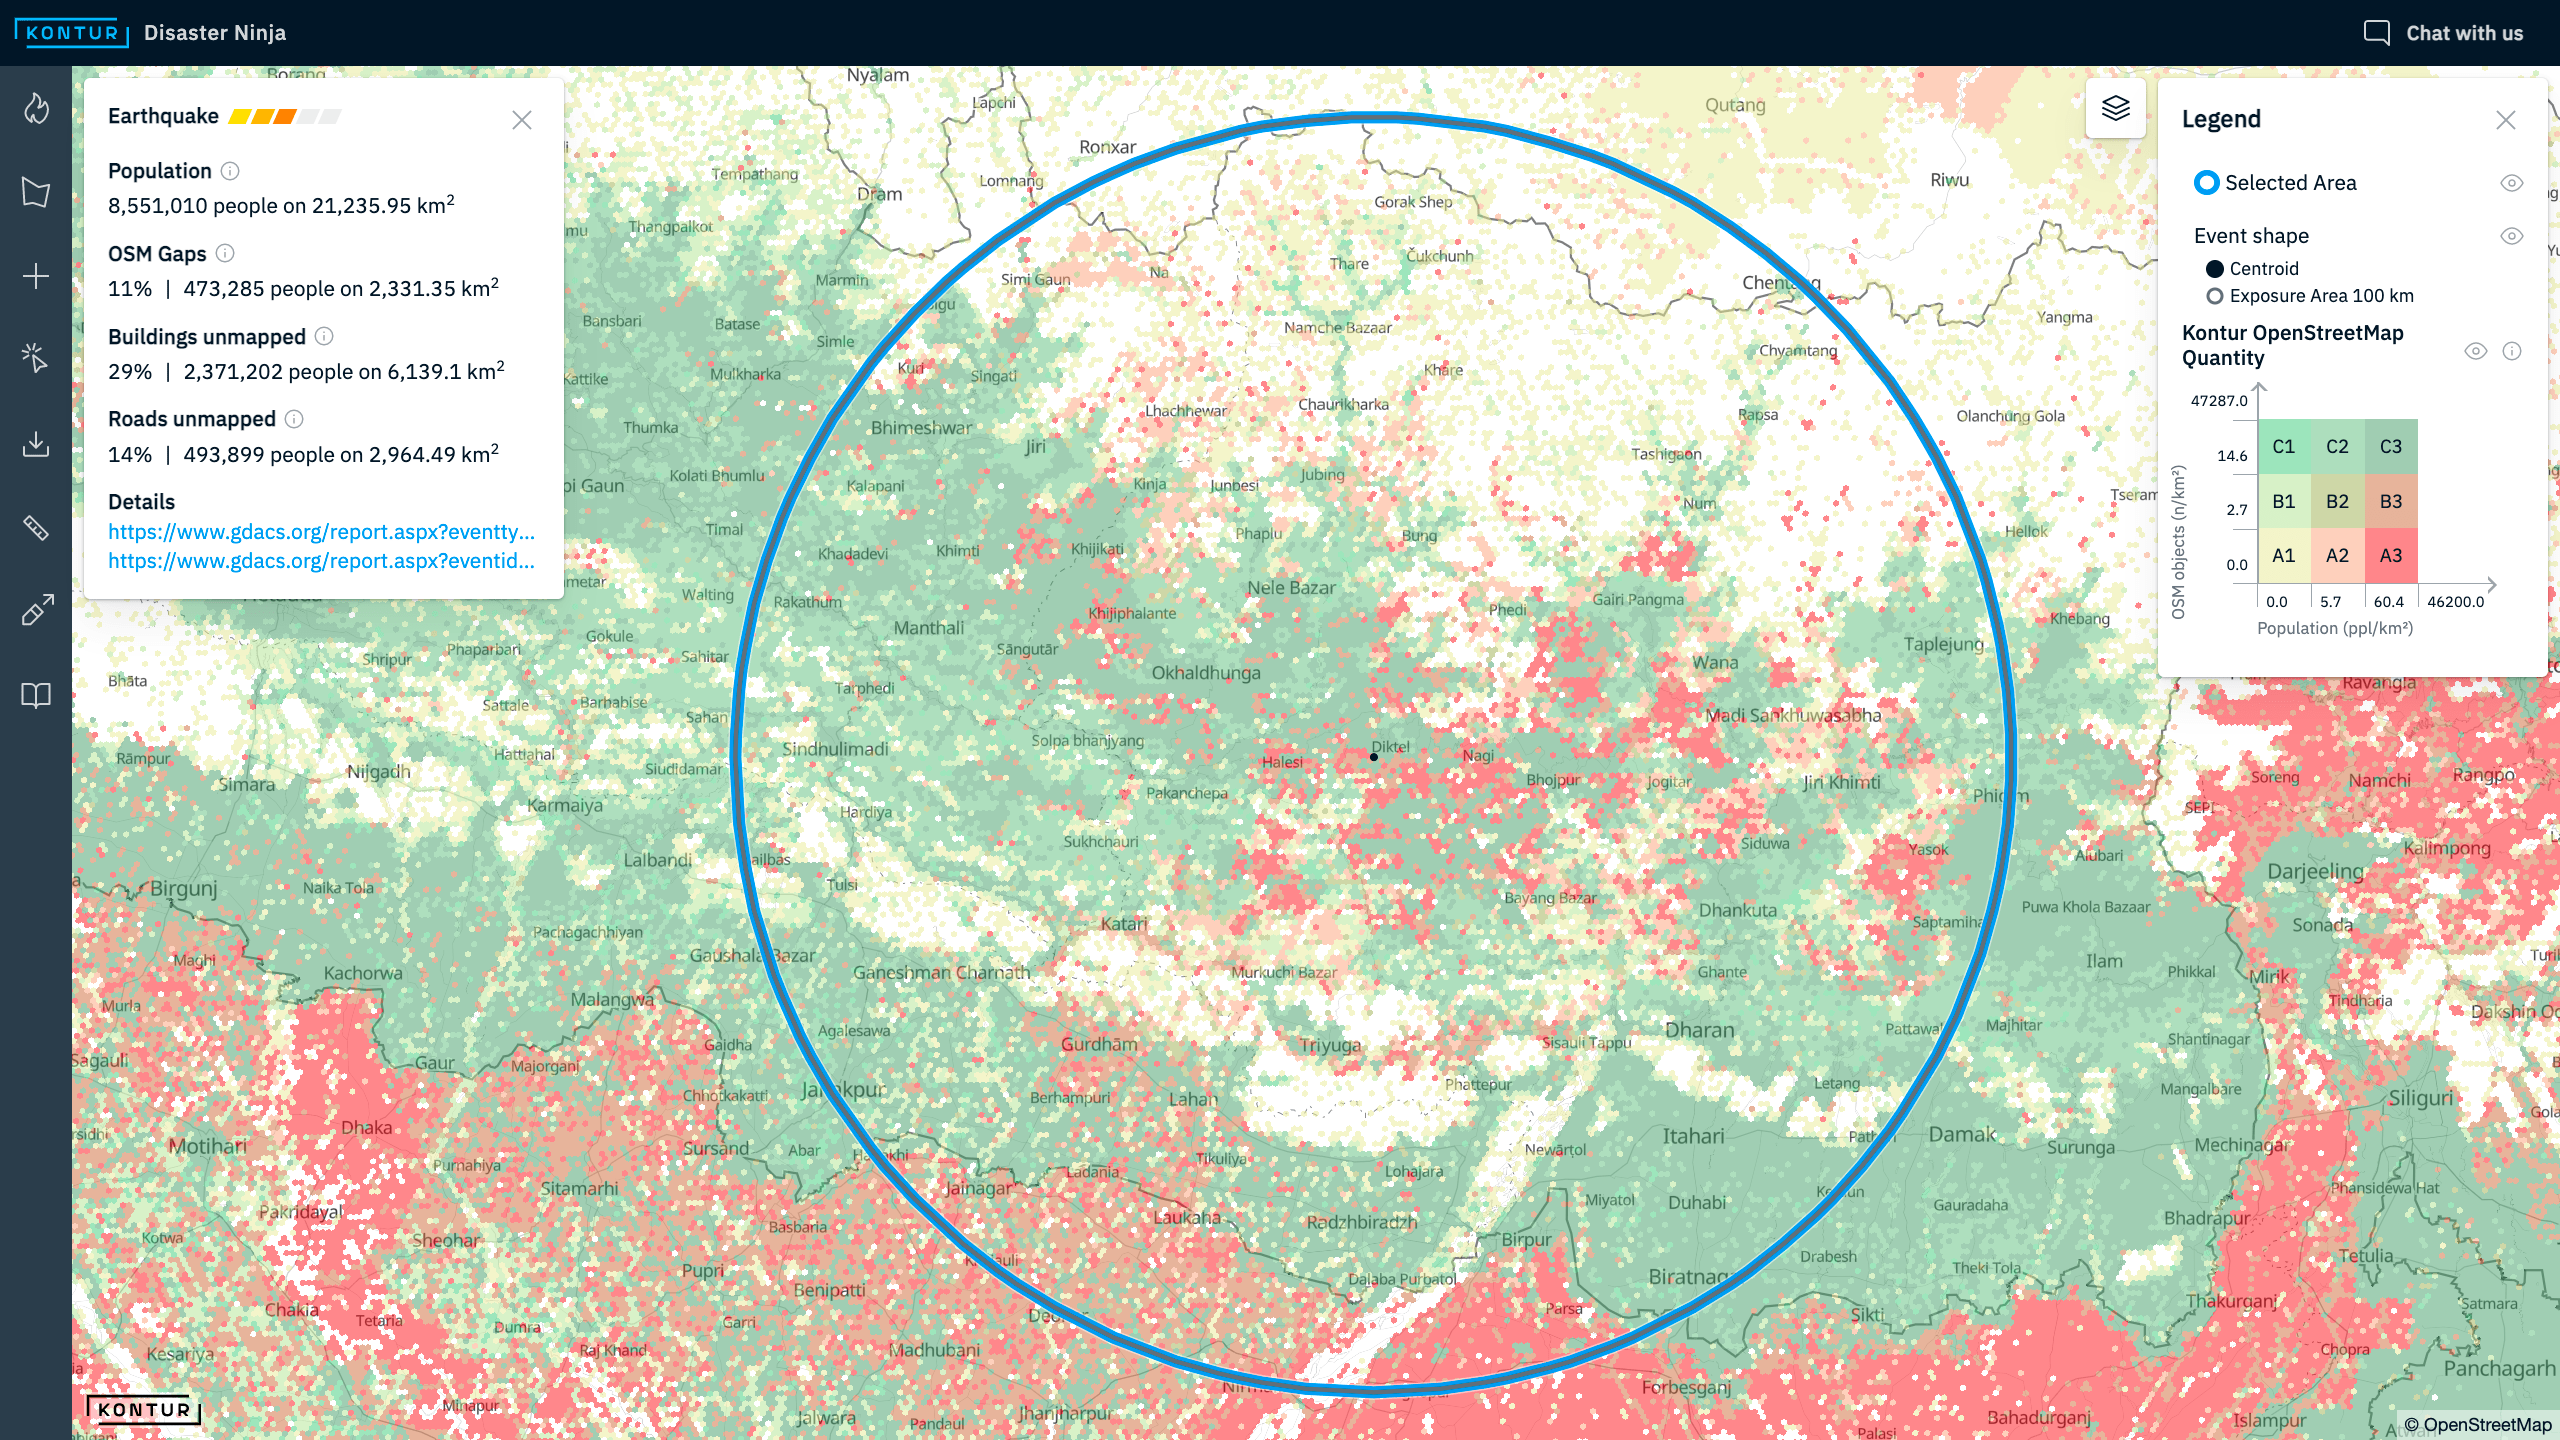
- Discover poorly mapped areas. Direct your mapping efforts to the populated regions with lower-than-expected mapping coverage, measured by the density of general objects, buildings, or roads in OpenStreetMap. (Made possible with Kontur OSM Quantity, Kontur OSM Building Quantity, and Kontur OSM Road Length layers)
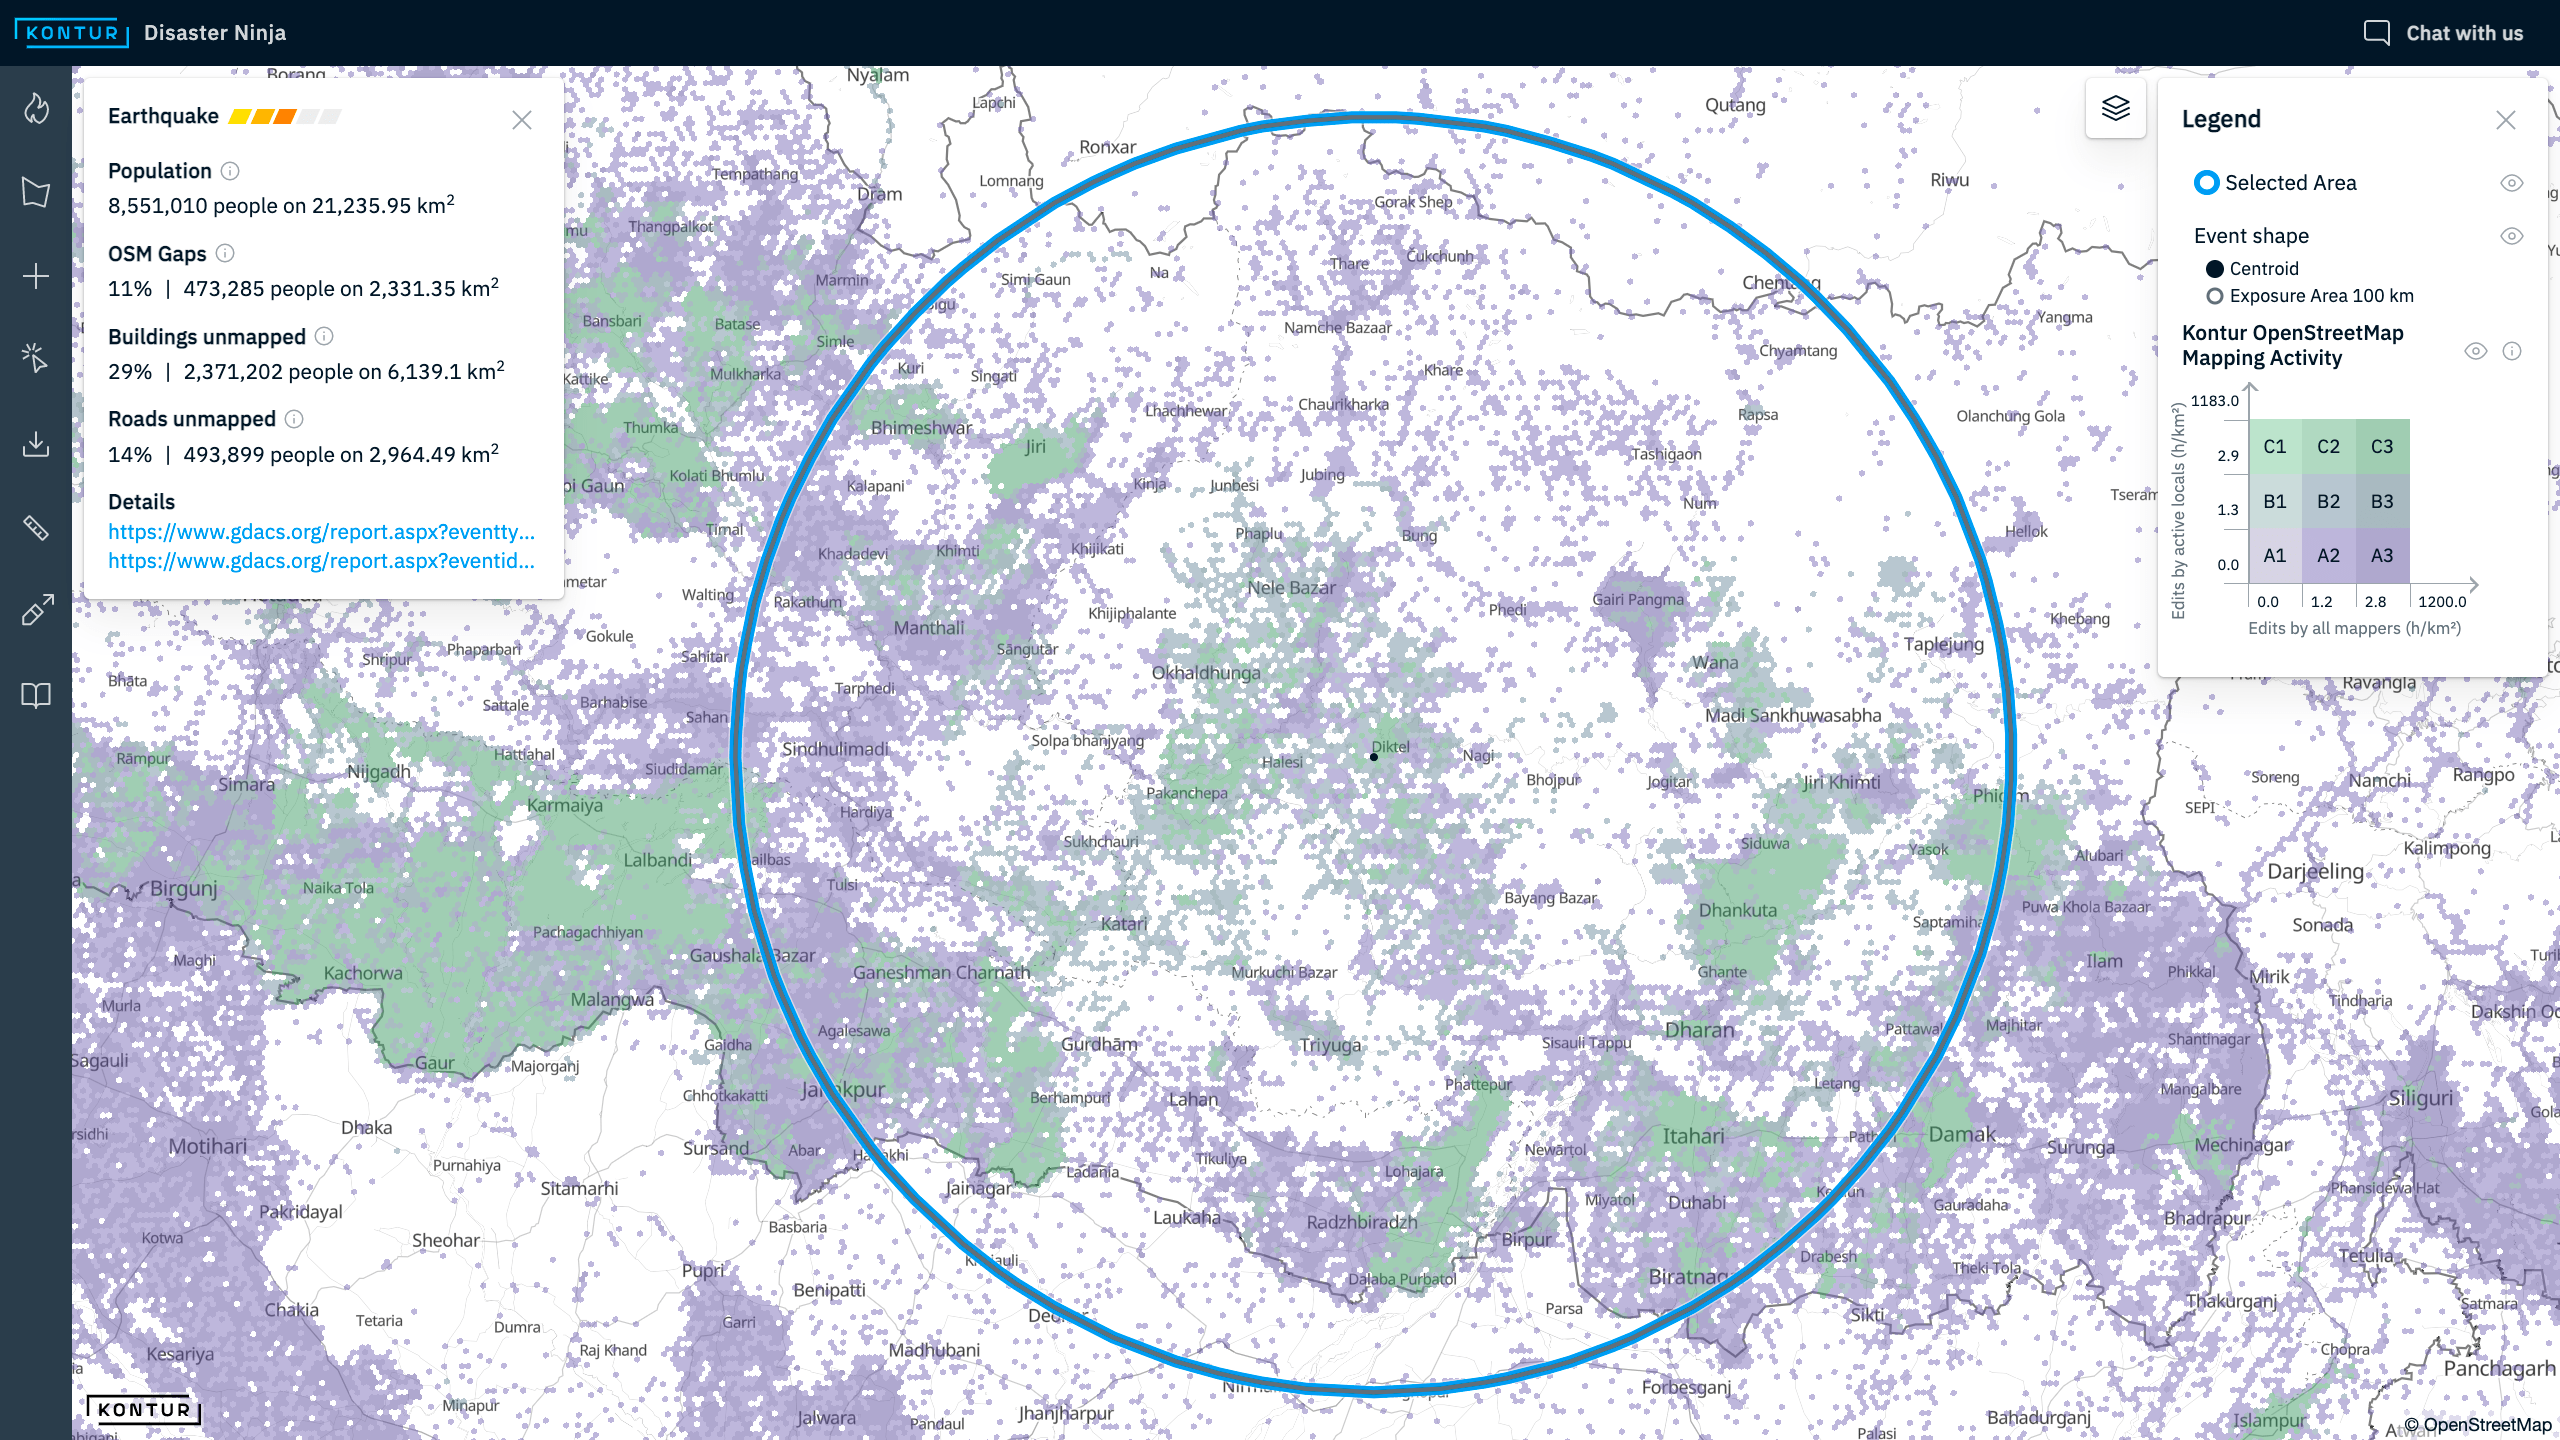
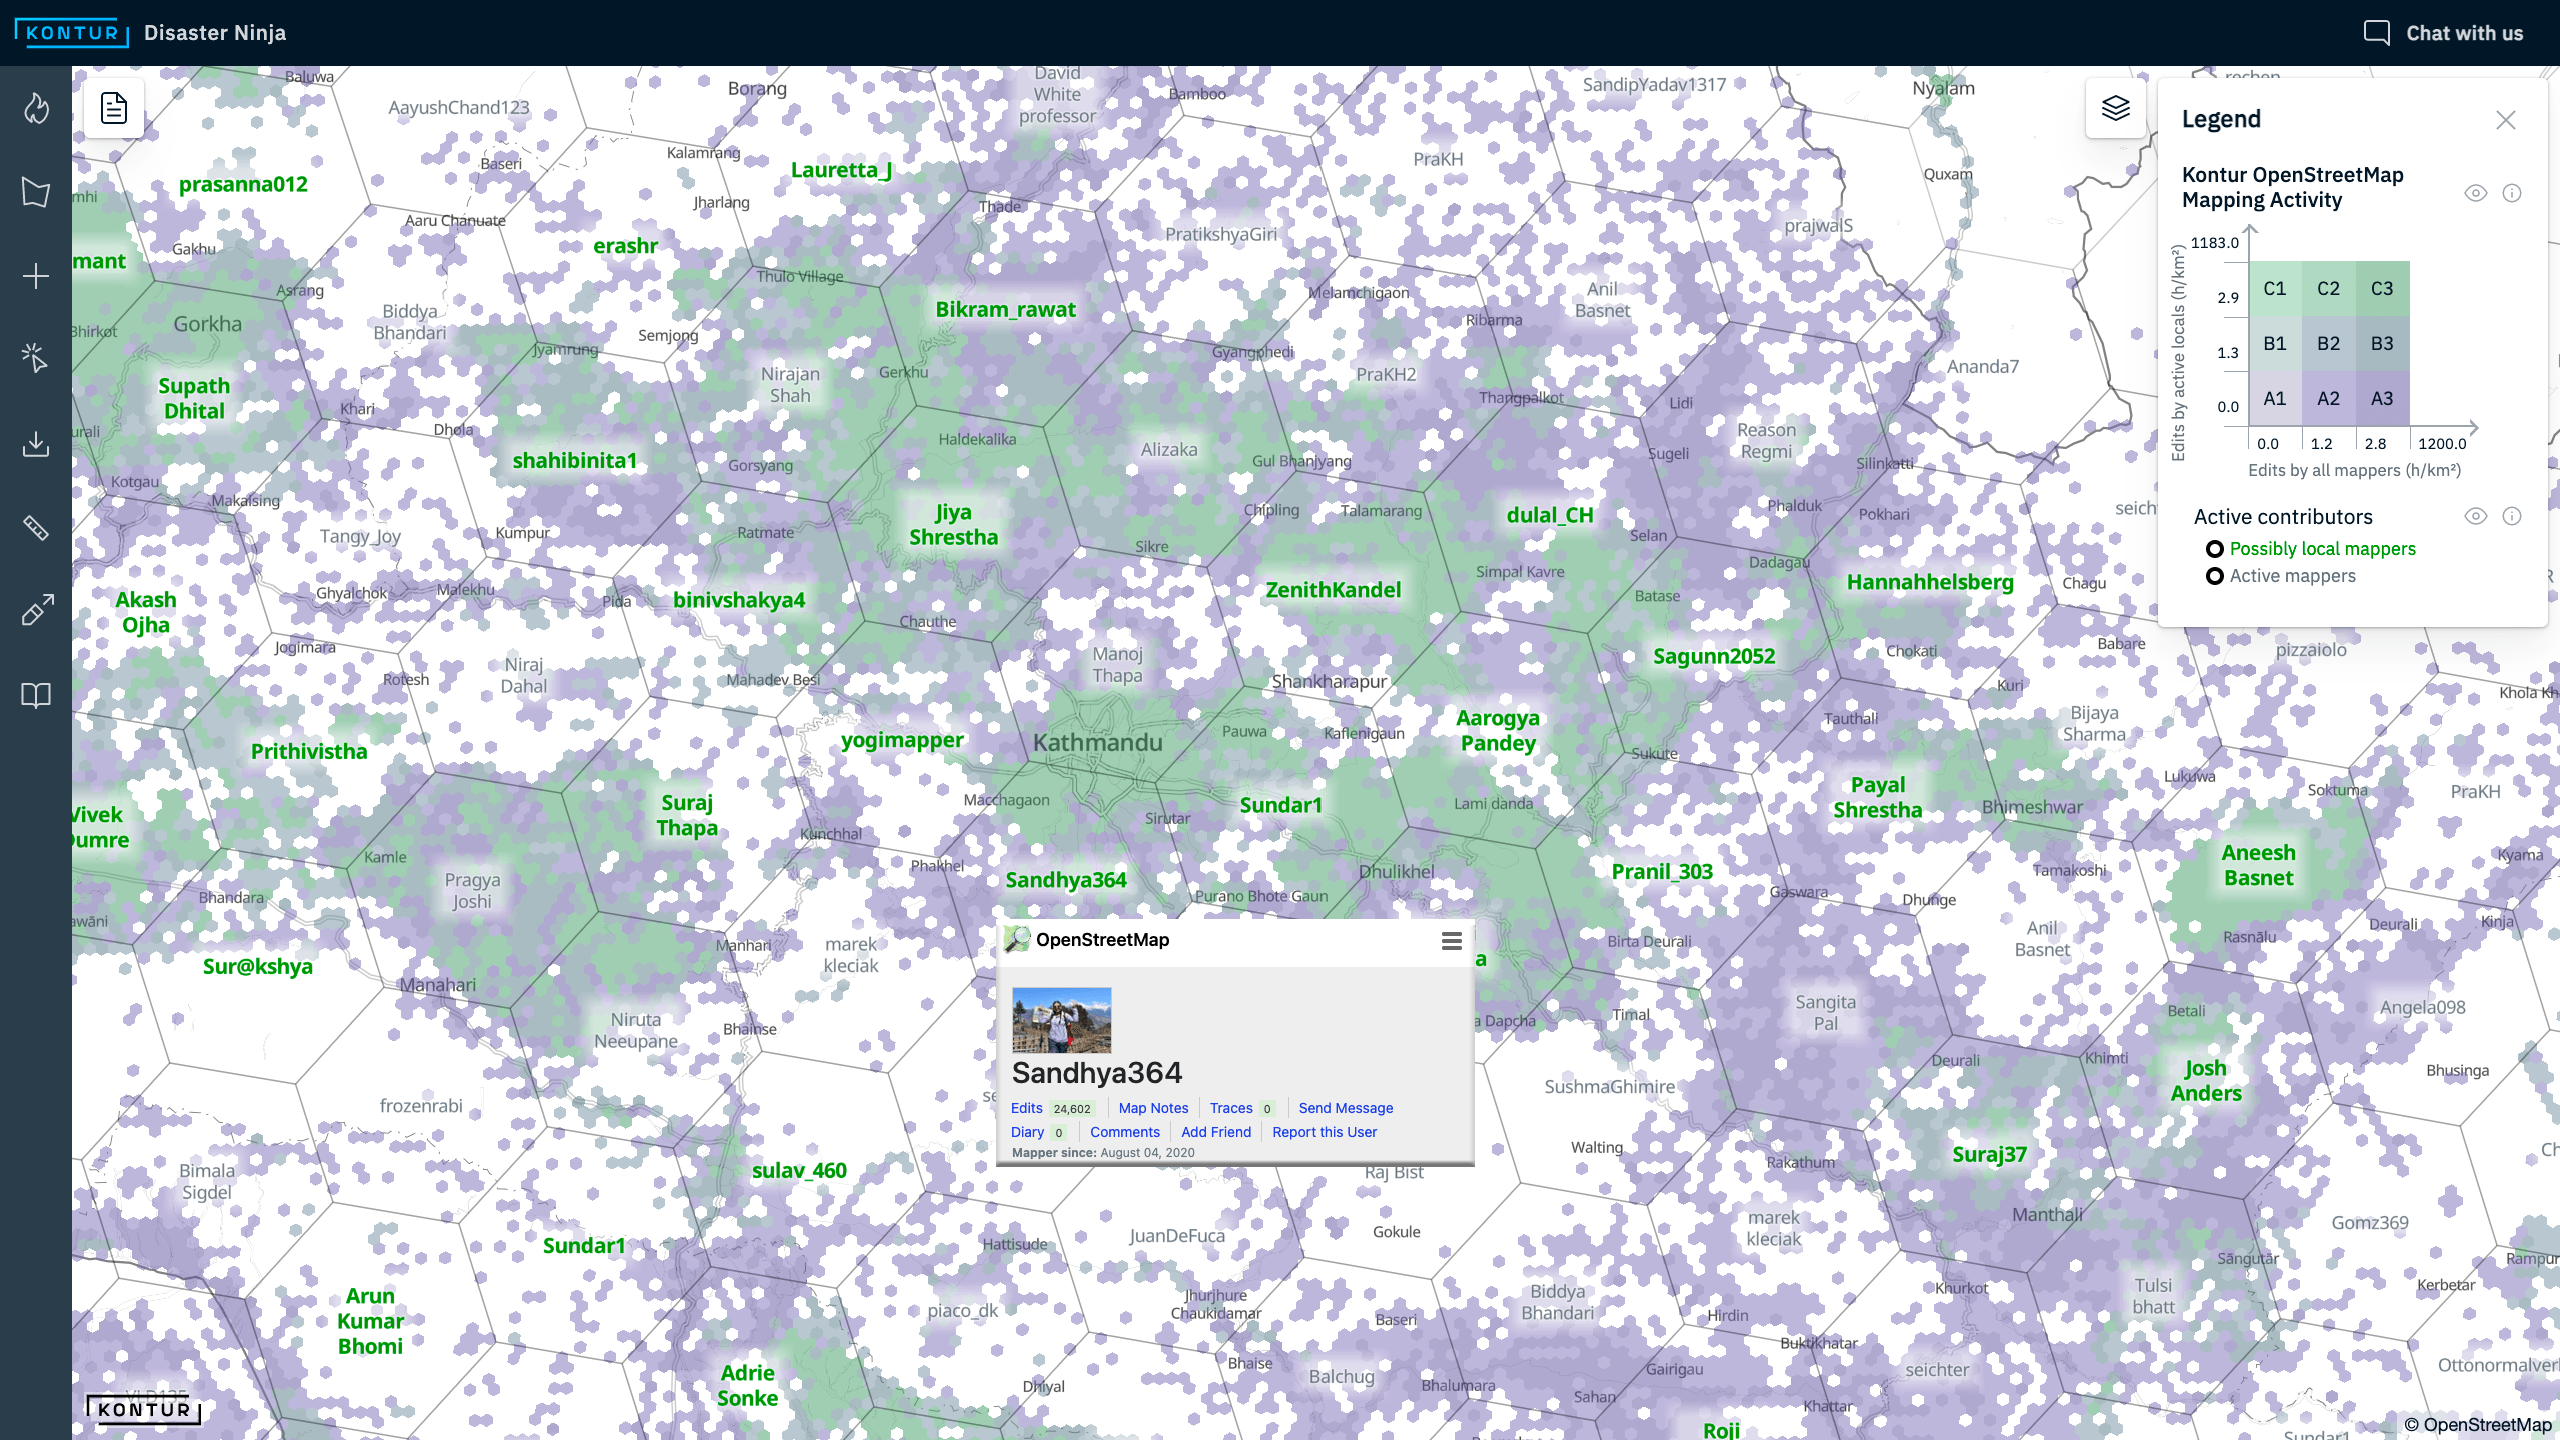
- Learn about mapping contributors. Compare the level of mapping activity within the last two years for each given area and estimate whether local or remote mappers worked on it. (Made possible with Kontur OSM Mapping Activity layer)
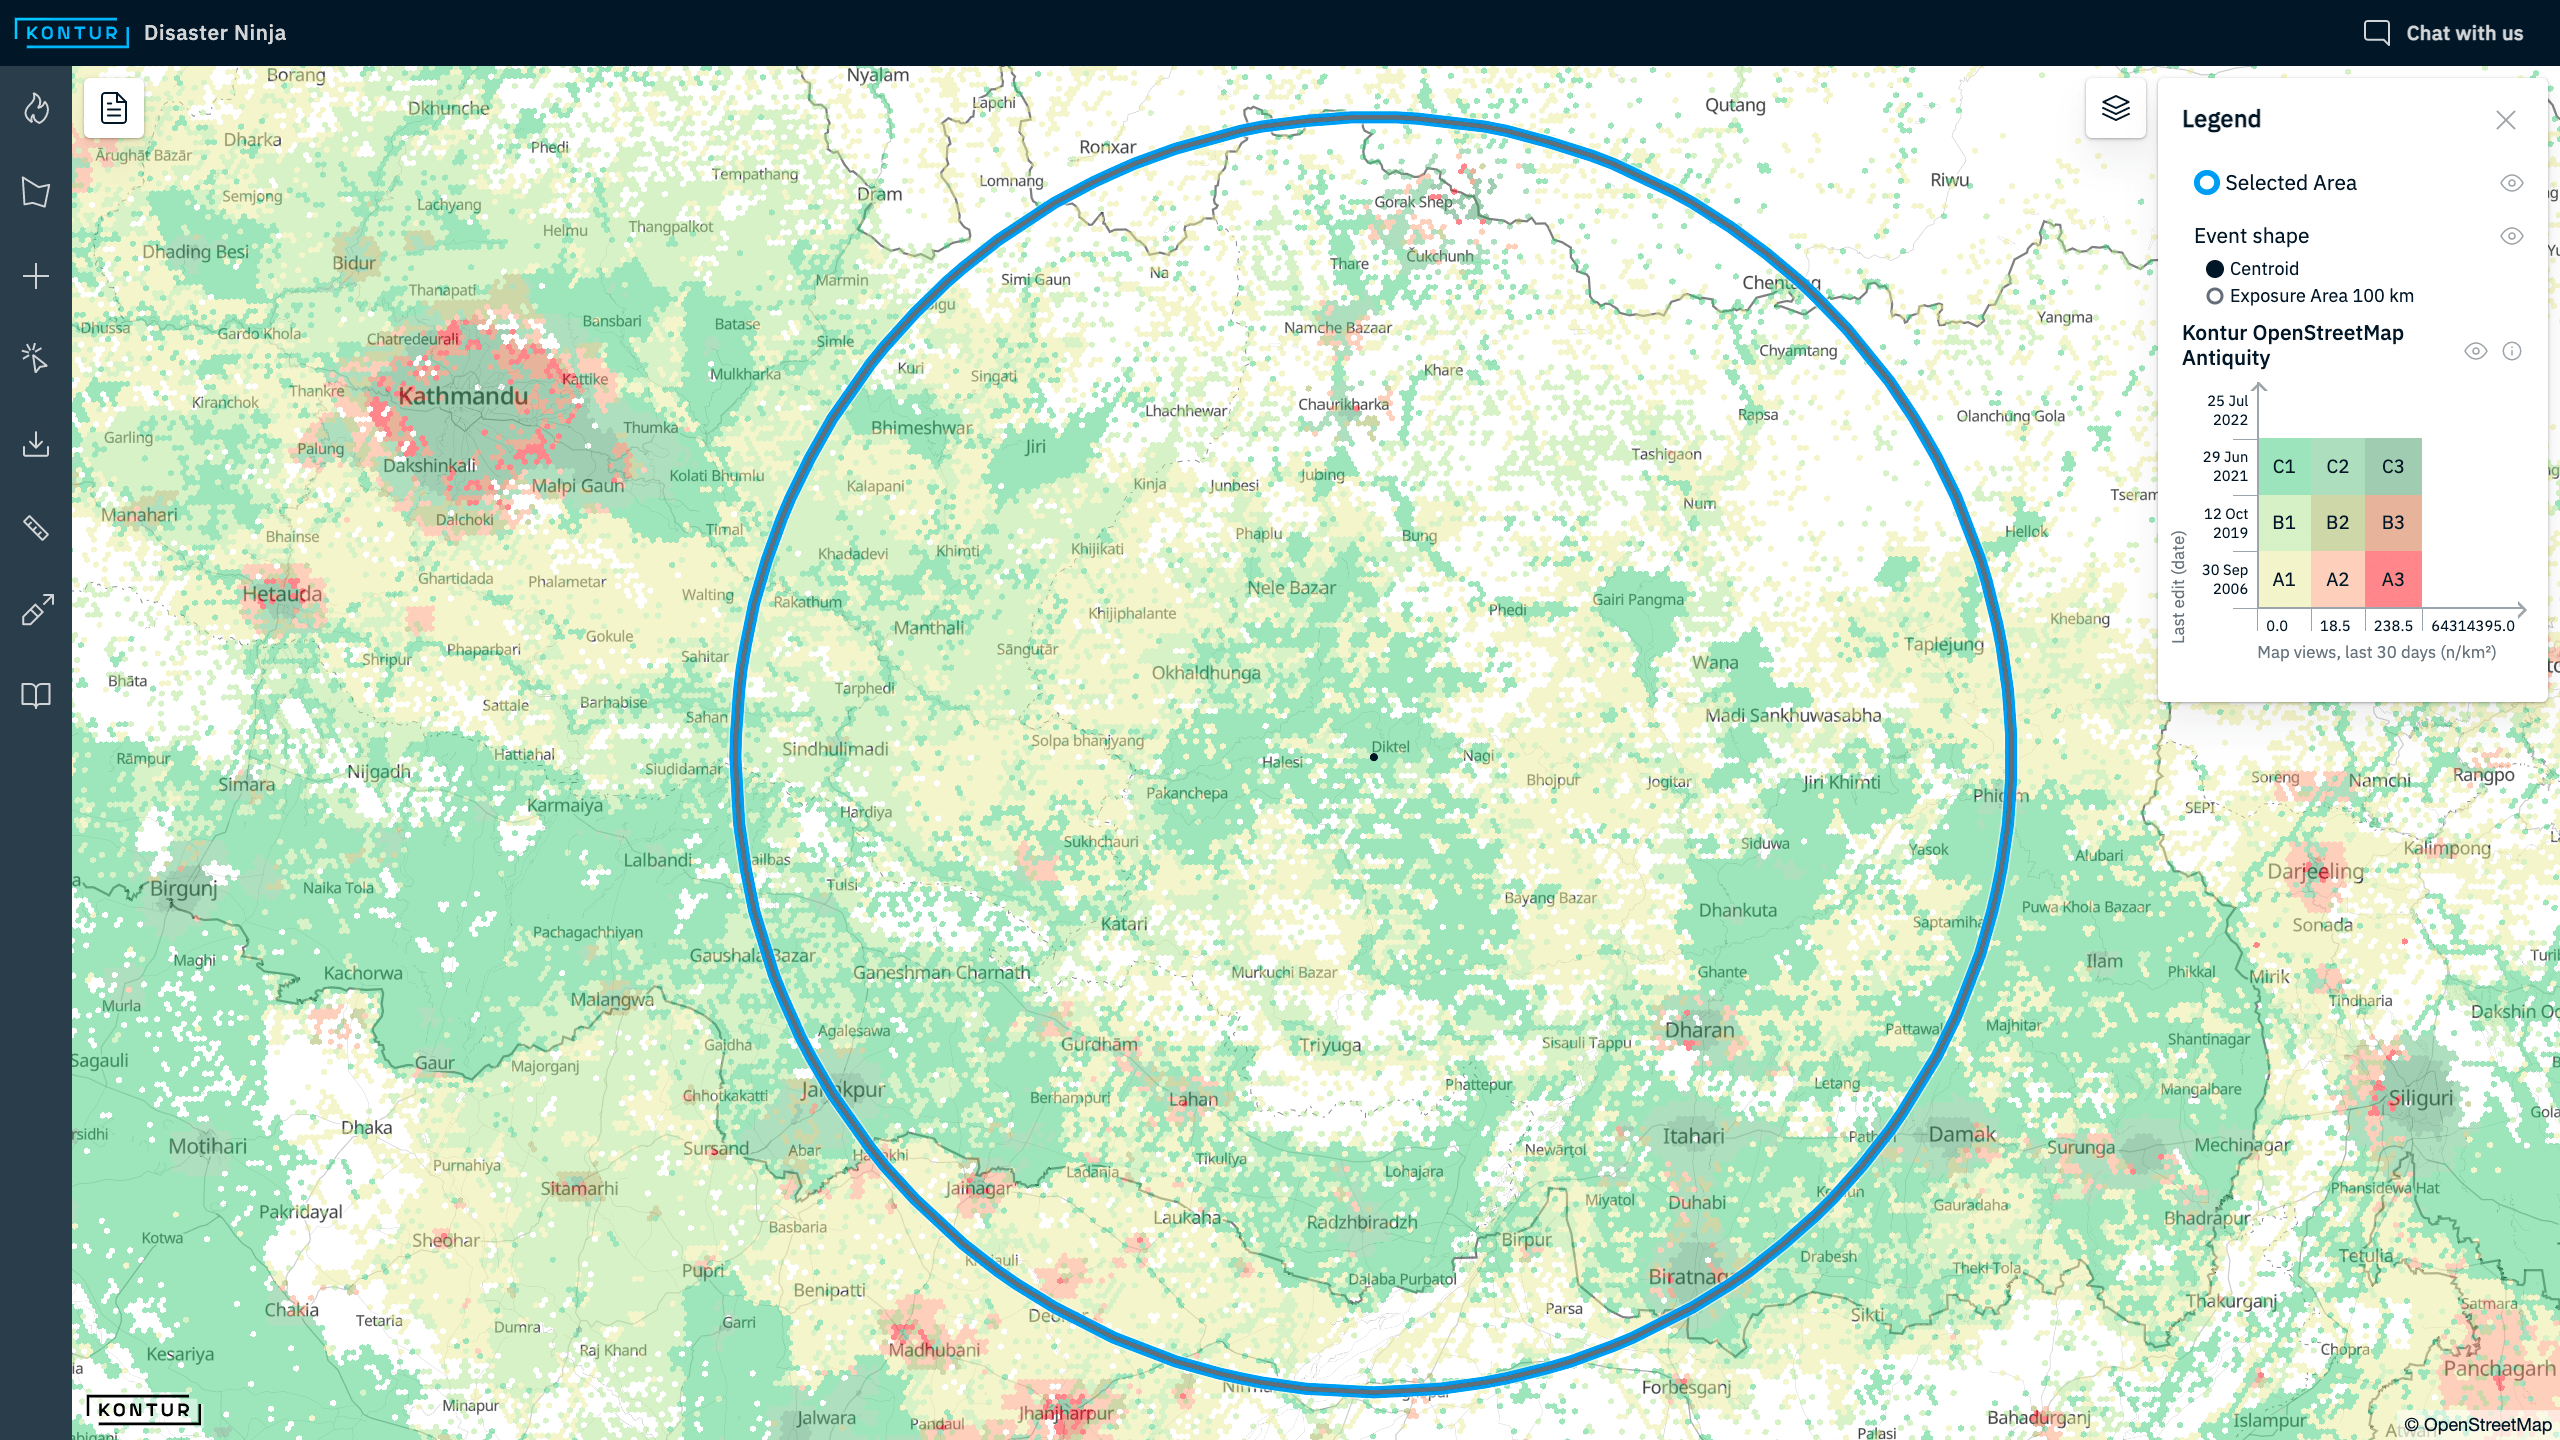
- Explore popular areas with old maps. You can find the most often viewed places by OpenStreetMap users within the last 30 days and compare that with the recency of the latest edits on the map. (Made possible with Kontur OSM Antiquity layer)
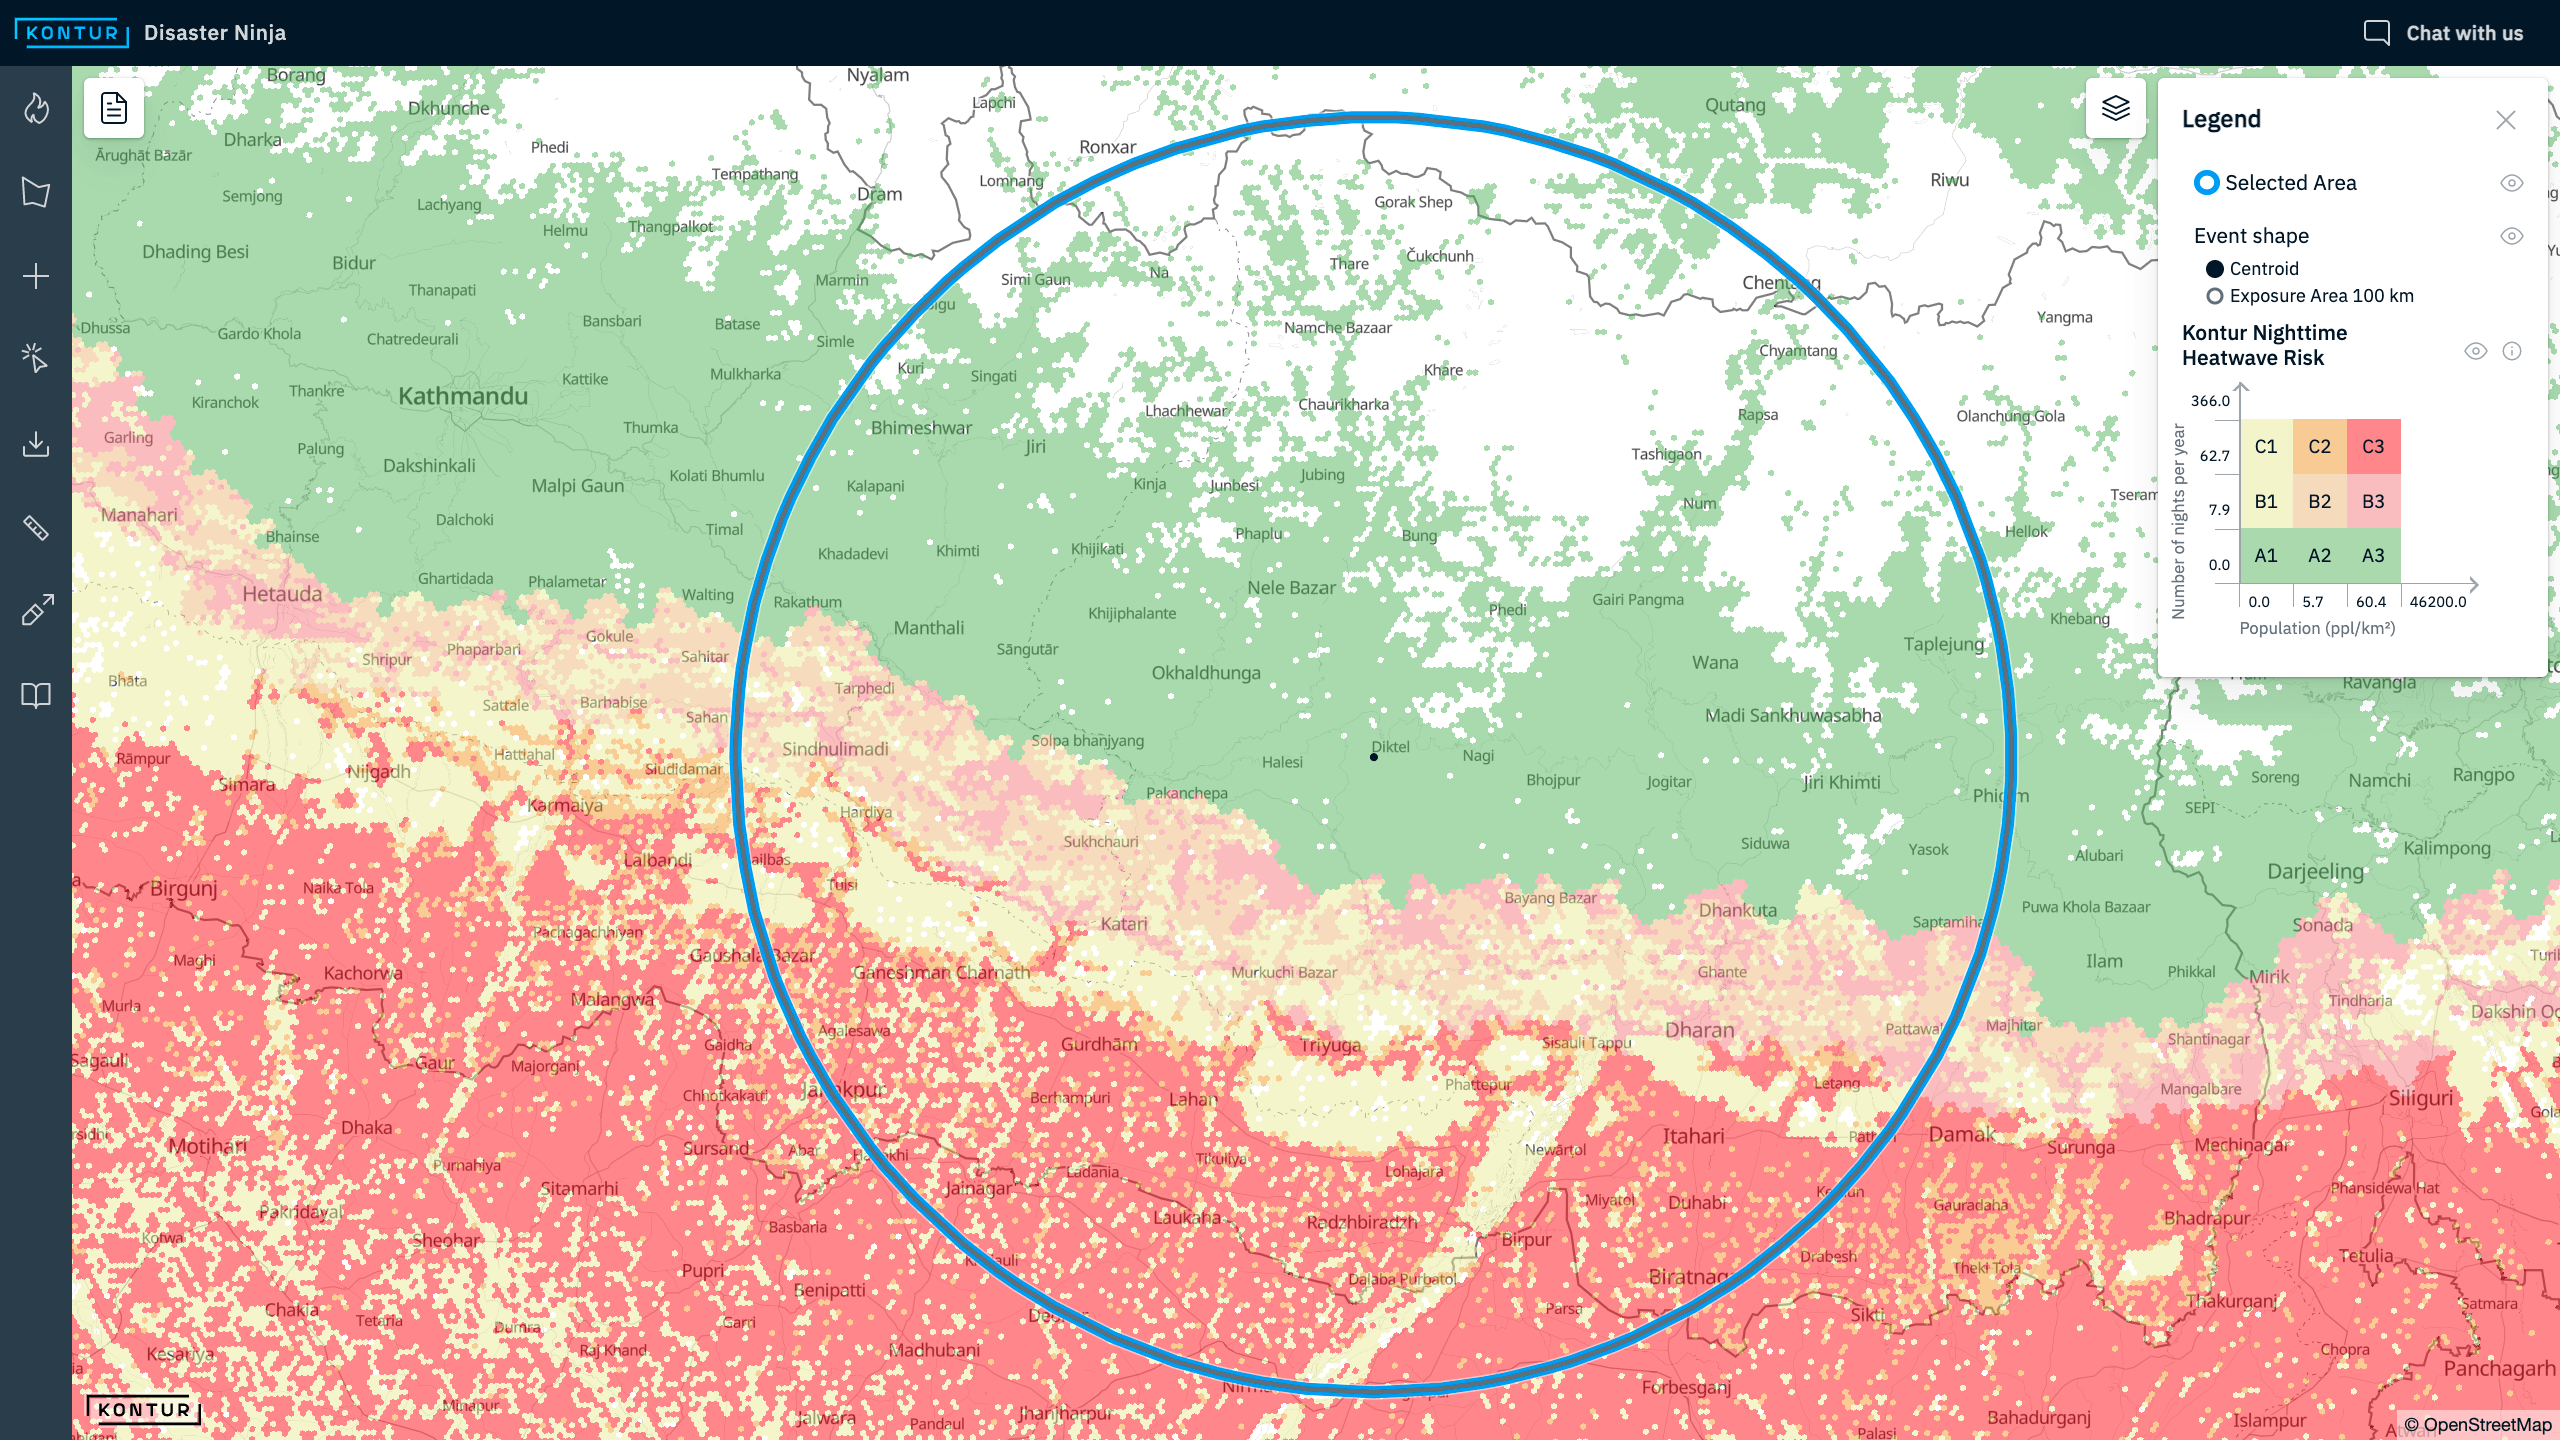
- Identify heat-stress risk areas. Find out where nighttime temperatures stay above 25°C for the longest time of the year and the highest number of people exposed to these. Due to climate change, the frequency of heatwaves gradually increases with wide-ranging detrimental consequences for local communities. (Made possible with Kontur Nighttime Heatwave Risk layer)
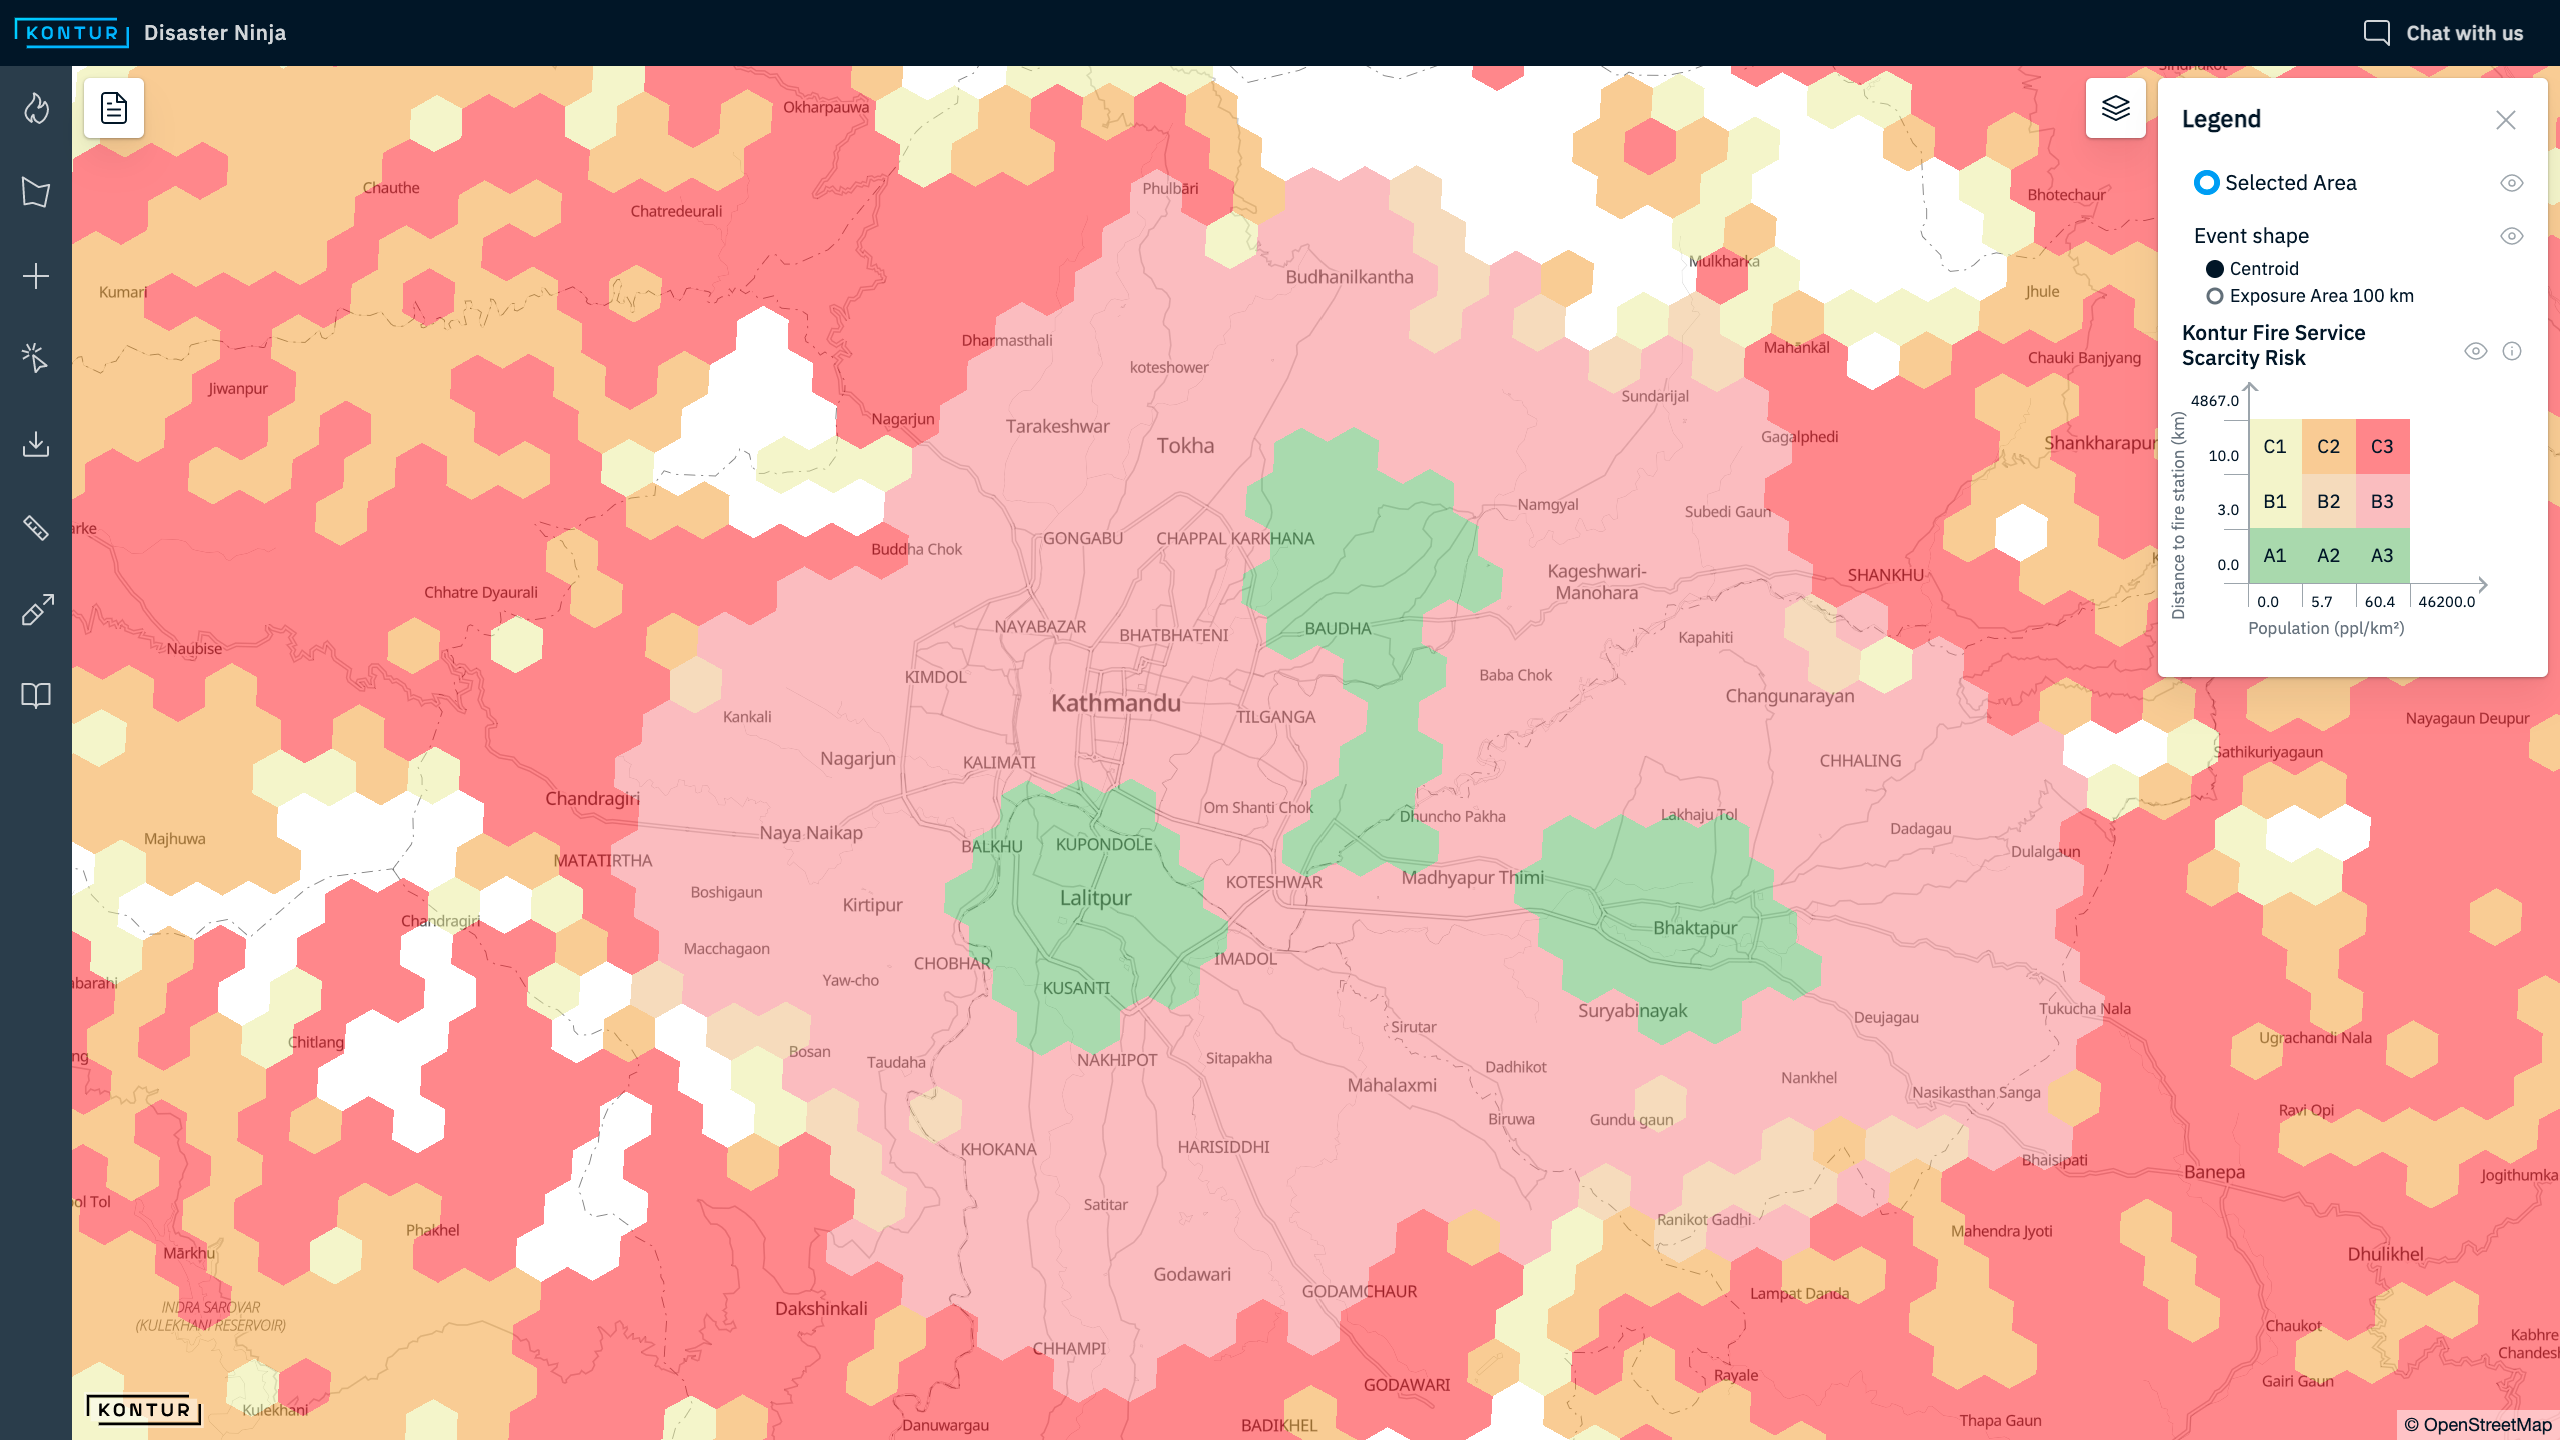
- Assess fire service scarcity risk. Comparing the distance to the closest fire station for each populated area can help you identify places at higher risk in case of a fire. (Made possible with Kontur Fire Service Scarcity Risk layer)
Explore these insights visually in the gallery below:
Interaction with local mappers
With Disaster Ninja, you can see the most active mapping contributors from OpenStreetMap for a given area. The OSM profiles of the contributors can be reached by clicking on their names in case the disaster event requires contacting locals for assistance in ground truth verification. You can also get to know how active the local community of a specific region is in general.
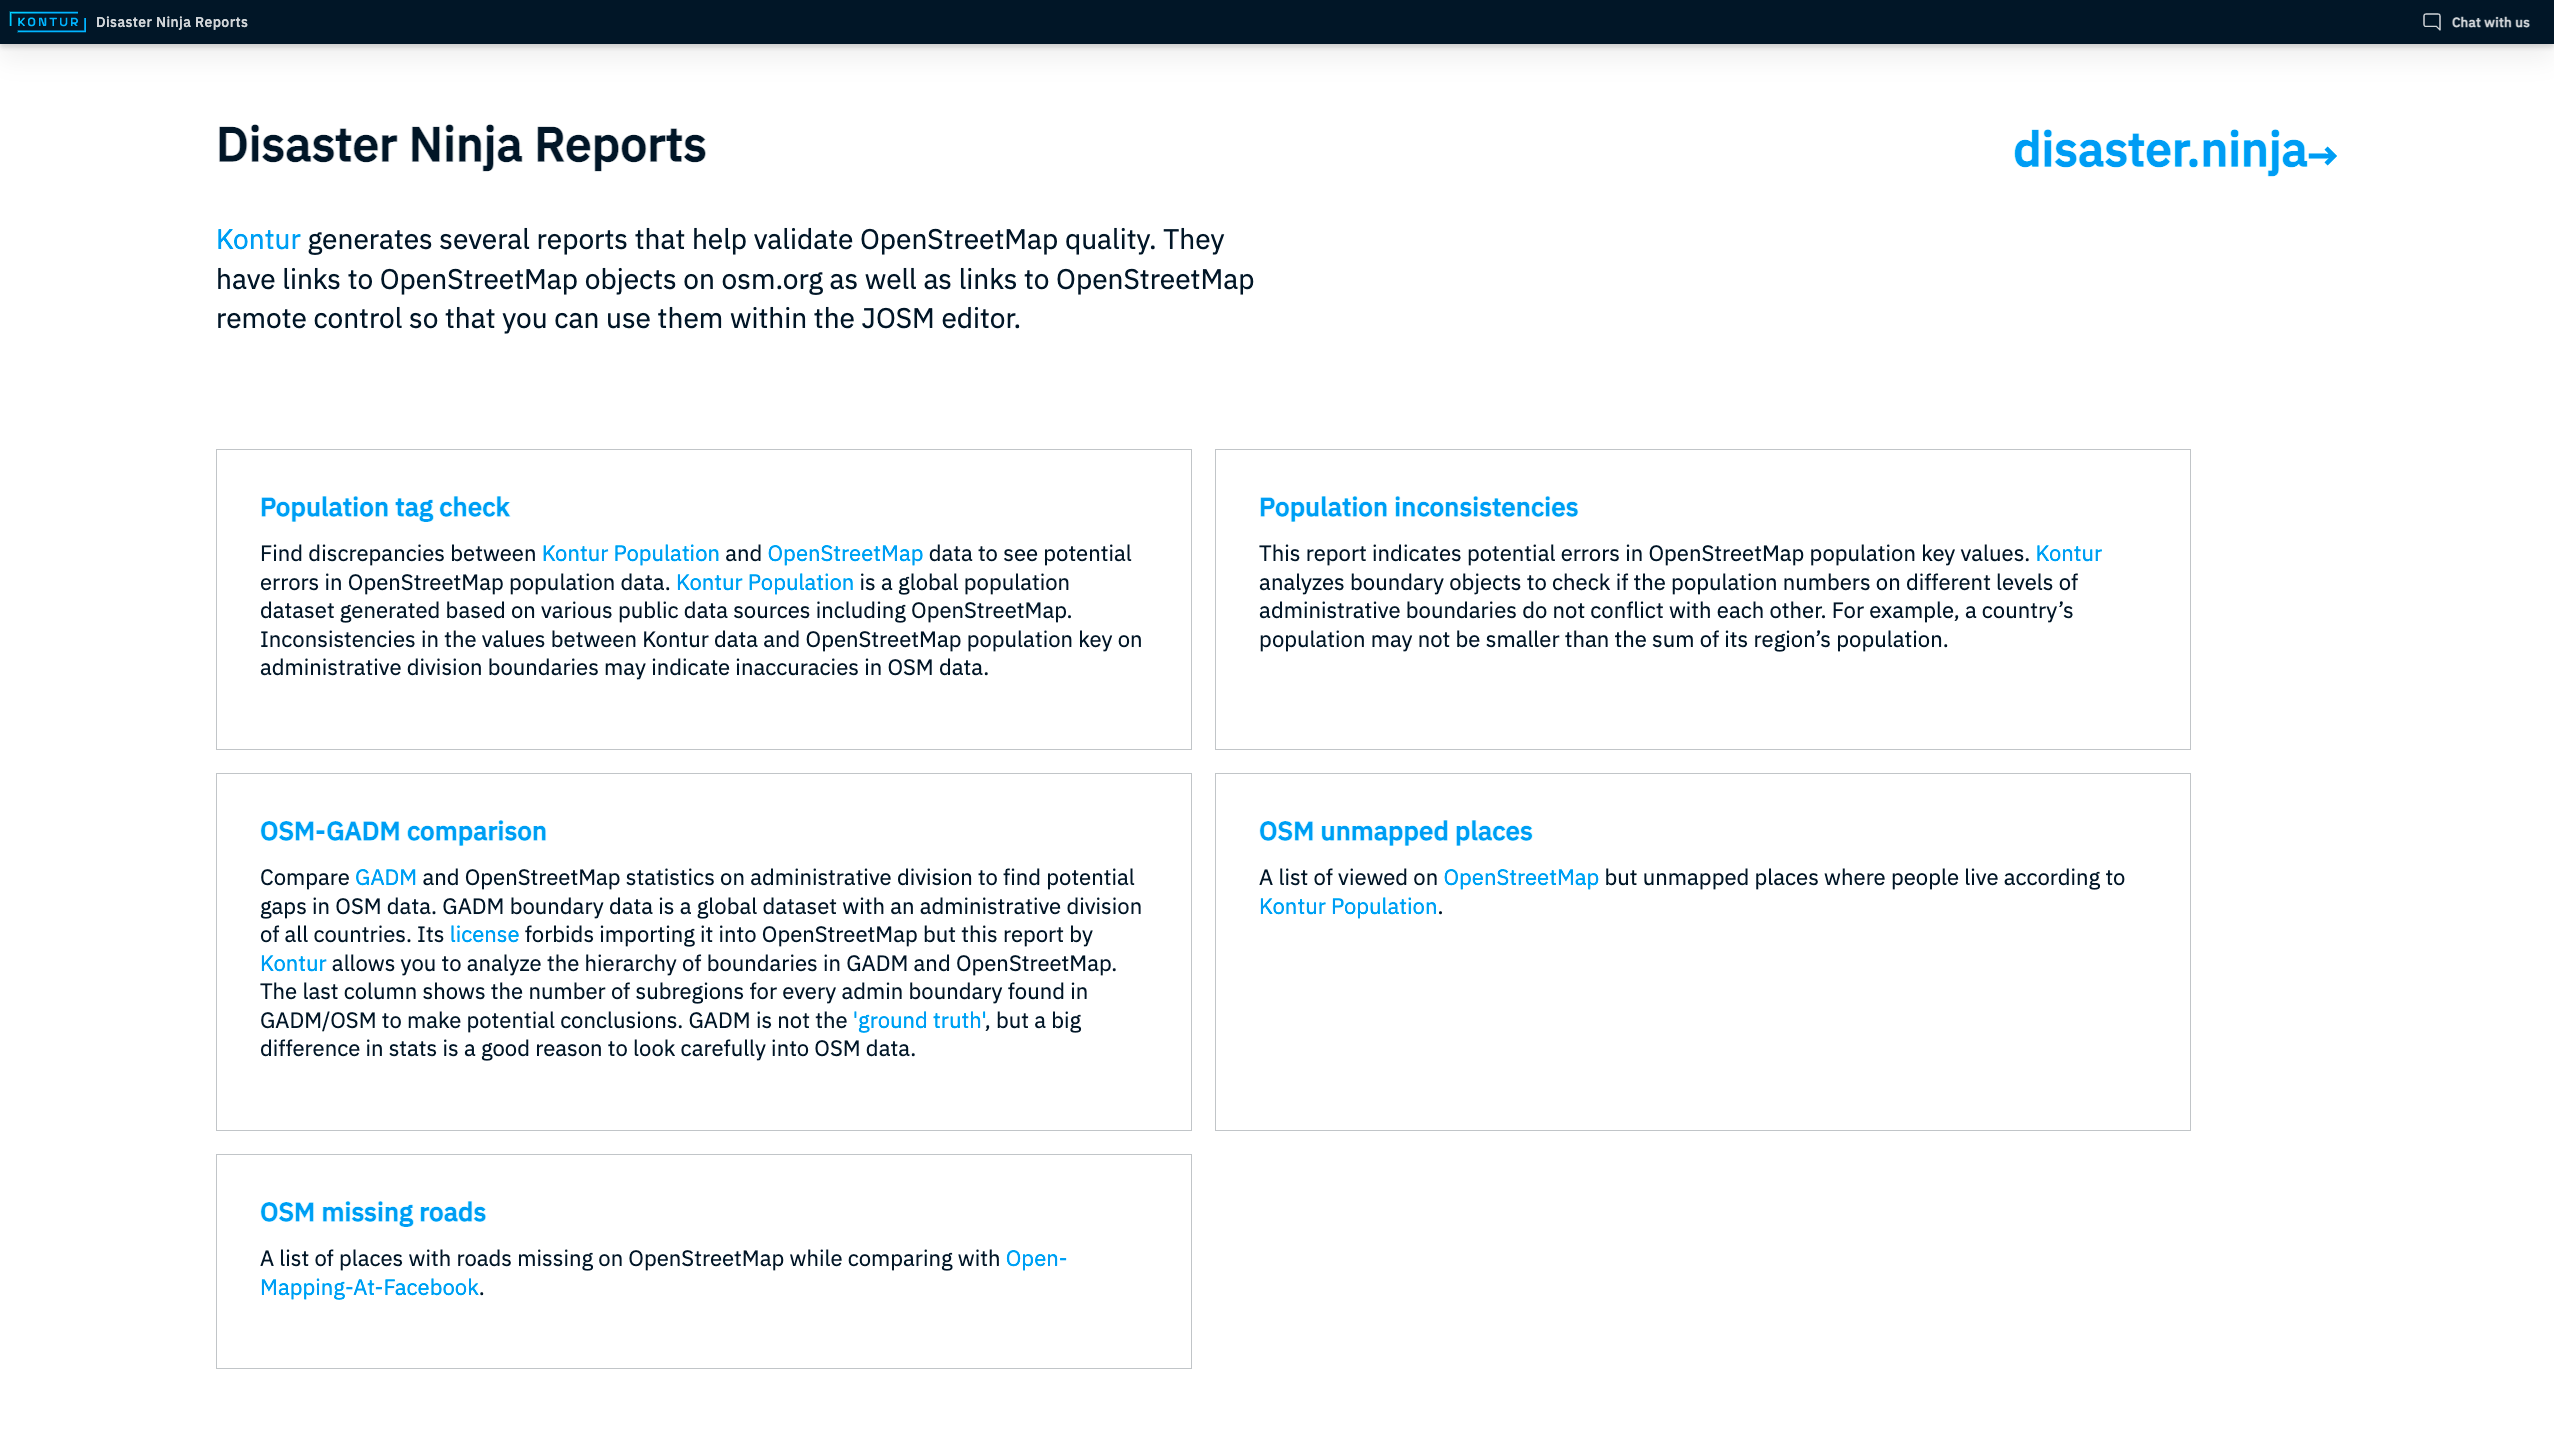
OpenStreetMap quality validation
Disaster Ninja features several reports that help validate OpenStreetMap quality. They help find potential errors and inconsistencies in OSM population data and fix administrative boundaries’ gaps.
In practice

Emergency mappers’ coordination involves quick decision making. It often means a trade-off between the speed of taking action and the outcome benefits.
An active contributor to the OpenStreetMap community, Kontur partnered with the Humanitarian OpenStreetMap Team (also known as HOT) to create a tool to support the rapid deployment of emergency mapping campaigns. Specifically, we could streamline and automate the Disaster Size-Up preparation process through technology, providing response coordinators with instant insights and freeing up time to maximize the efficiency of volunteer mappers’ work.
‘Disaster Ninja is cutting the size-up time in half. Now it’s possible within an hour to have a good feeling if there is a reason to activate or not. I truly appreciate having very helpful layers into one package because it’s definitely saving time.’
– Russell Deffner, HOT Response Coordinator
Using Kontur’s GIS platform as a basis, we created the interactive Disaster Ninja dashboard that allows HOT’s response coordinators to outline the affected area and prepare a Size-Up specification without delay. In addition, we built a notification engine that sends alerts about new disaster events and their details to HOT Slack. With just one click, the coordinator can start analyzing the event in the Disaster Ninja interface.
In this blog post, you can read more about how we did it, including specific emergency cases.
In the news
Mapbox Community Blog:
Optimize Crisis Response with OpenStreetMap + Disaster Ninja
Probable Futures:
Probable Futures and Mapbox Team Up to Help Mapbox Users Illustrate Climate Impacts
The Daily Star:
Facebook Launches High Definition Area Map for Asia Pacific Region
Maps Mania:
OSM Coverage & Population Density
Summing up
Disaster Ninja’s role in humanitarian mapping
Numerous tools and systems are used for increasing situational awareness and improving decision making during disaster response. These include spatial datasets, base maps, data feeds, communication tools, analytics, and more.
While there are valuable solutions for each task on the agenda of humanitarian mappers, Disaster Ninja aims to integrate the different elements and information that response coordinators need at the initial stage of event impact evaluation and deliver them in a single tool. Thus, the response providers save precious time early in a disaster and can use that time for subsequent activities and local help to those in need.
Next step
Disaster Ninja is available with most functionality for free. Start using it to create a positive impact now: https://disaster.ninja/active/
If you have questions or suggestions on Disaster Ninja, write to hello@kontur.io or get in touch through the chatbox.