Atlas login
By Veranika Rechits, Yevhen Kyslomed, and Misha Malikin
Using open data to explore and optimize fire departments service areas
A city’s ability to protect citizens from both natural and human-made emergencies is essential and critical to protecting life and property. One of the standard indicators of a city’s preparedness for fires is the number of firefighters per 100,000 population. But optimizing the location of fire departments is an equally important factor that can make the difference between life and death, salvation and destruction.
Fire stations are headquarters for a service performed away from the site. It means one properly located firehouse provides more protection than several poorly located ones. Kontur uses its geospatial platform’s capabilities to provide insights on potential fire service scarcity and optimal fire department locations.
Why we do it
It is essential for governments and municipal authorities to properly locate fire stations and determine where they lack coverage. Human communities expand into forests and grasslands yearly, creating areas of intermediate population density called the Wildland-Urban Interface (WUI). Most human-caused accidental fires occur in these WUI areas, where flammable vegetation meets residential developments.
As a result of global warming, fire seasons are now averaging two months longer than the historic norm globally. As a result, areas burned due to wildfires annually are record-breaking. With increasing demands, the fire service needs to utilize the most advanced geospatial technology to maximize the coverage and minimize the response time.
How we do it
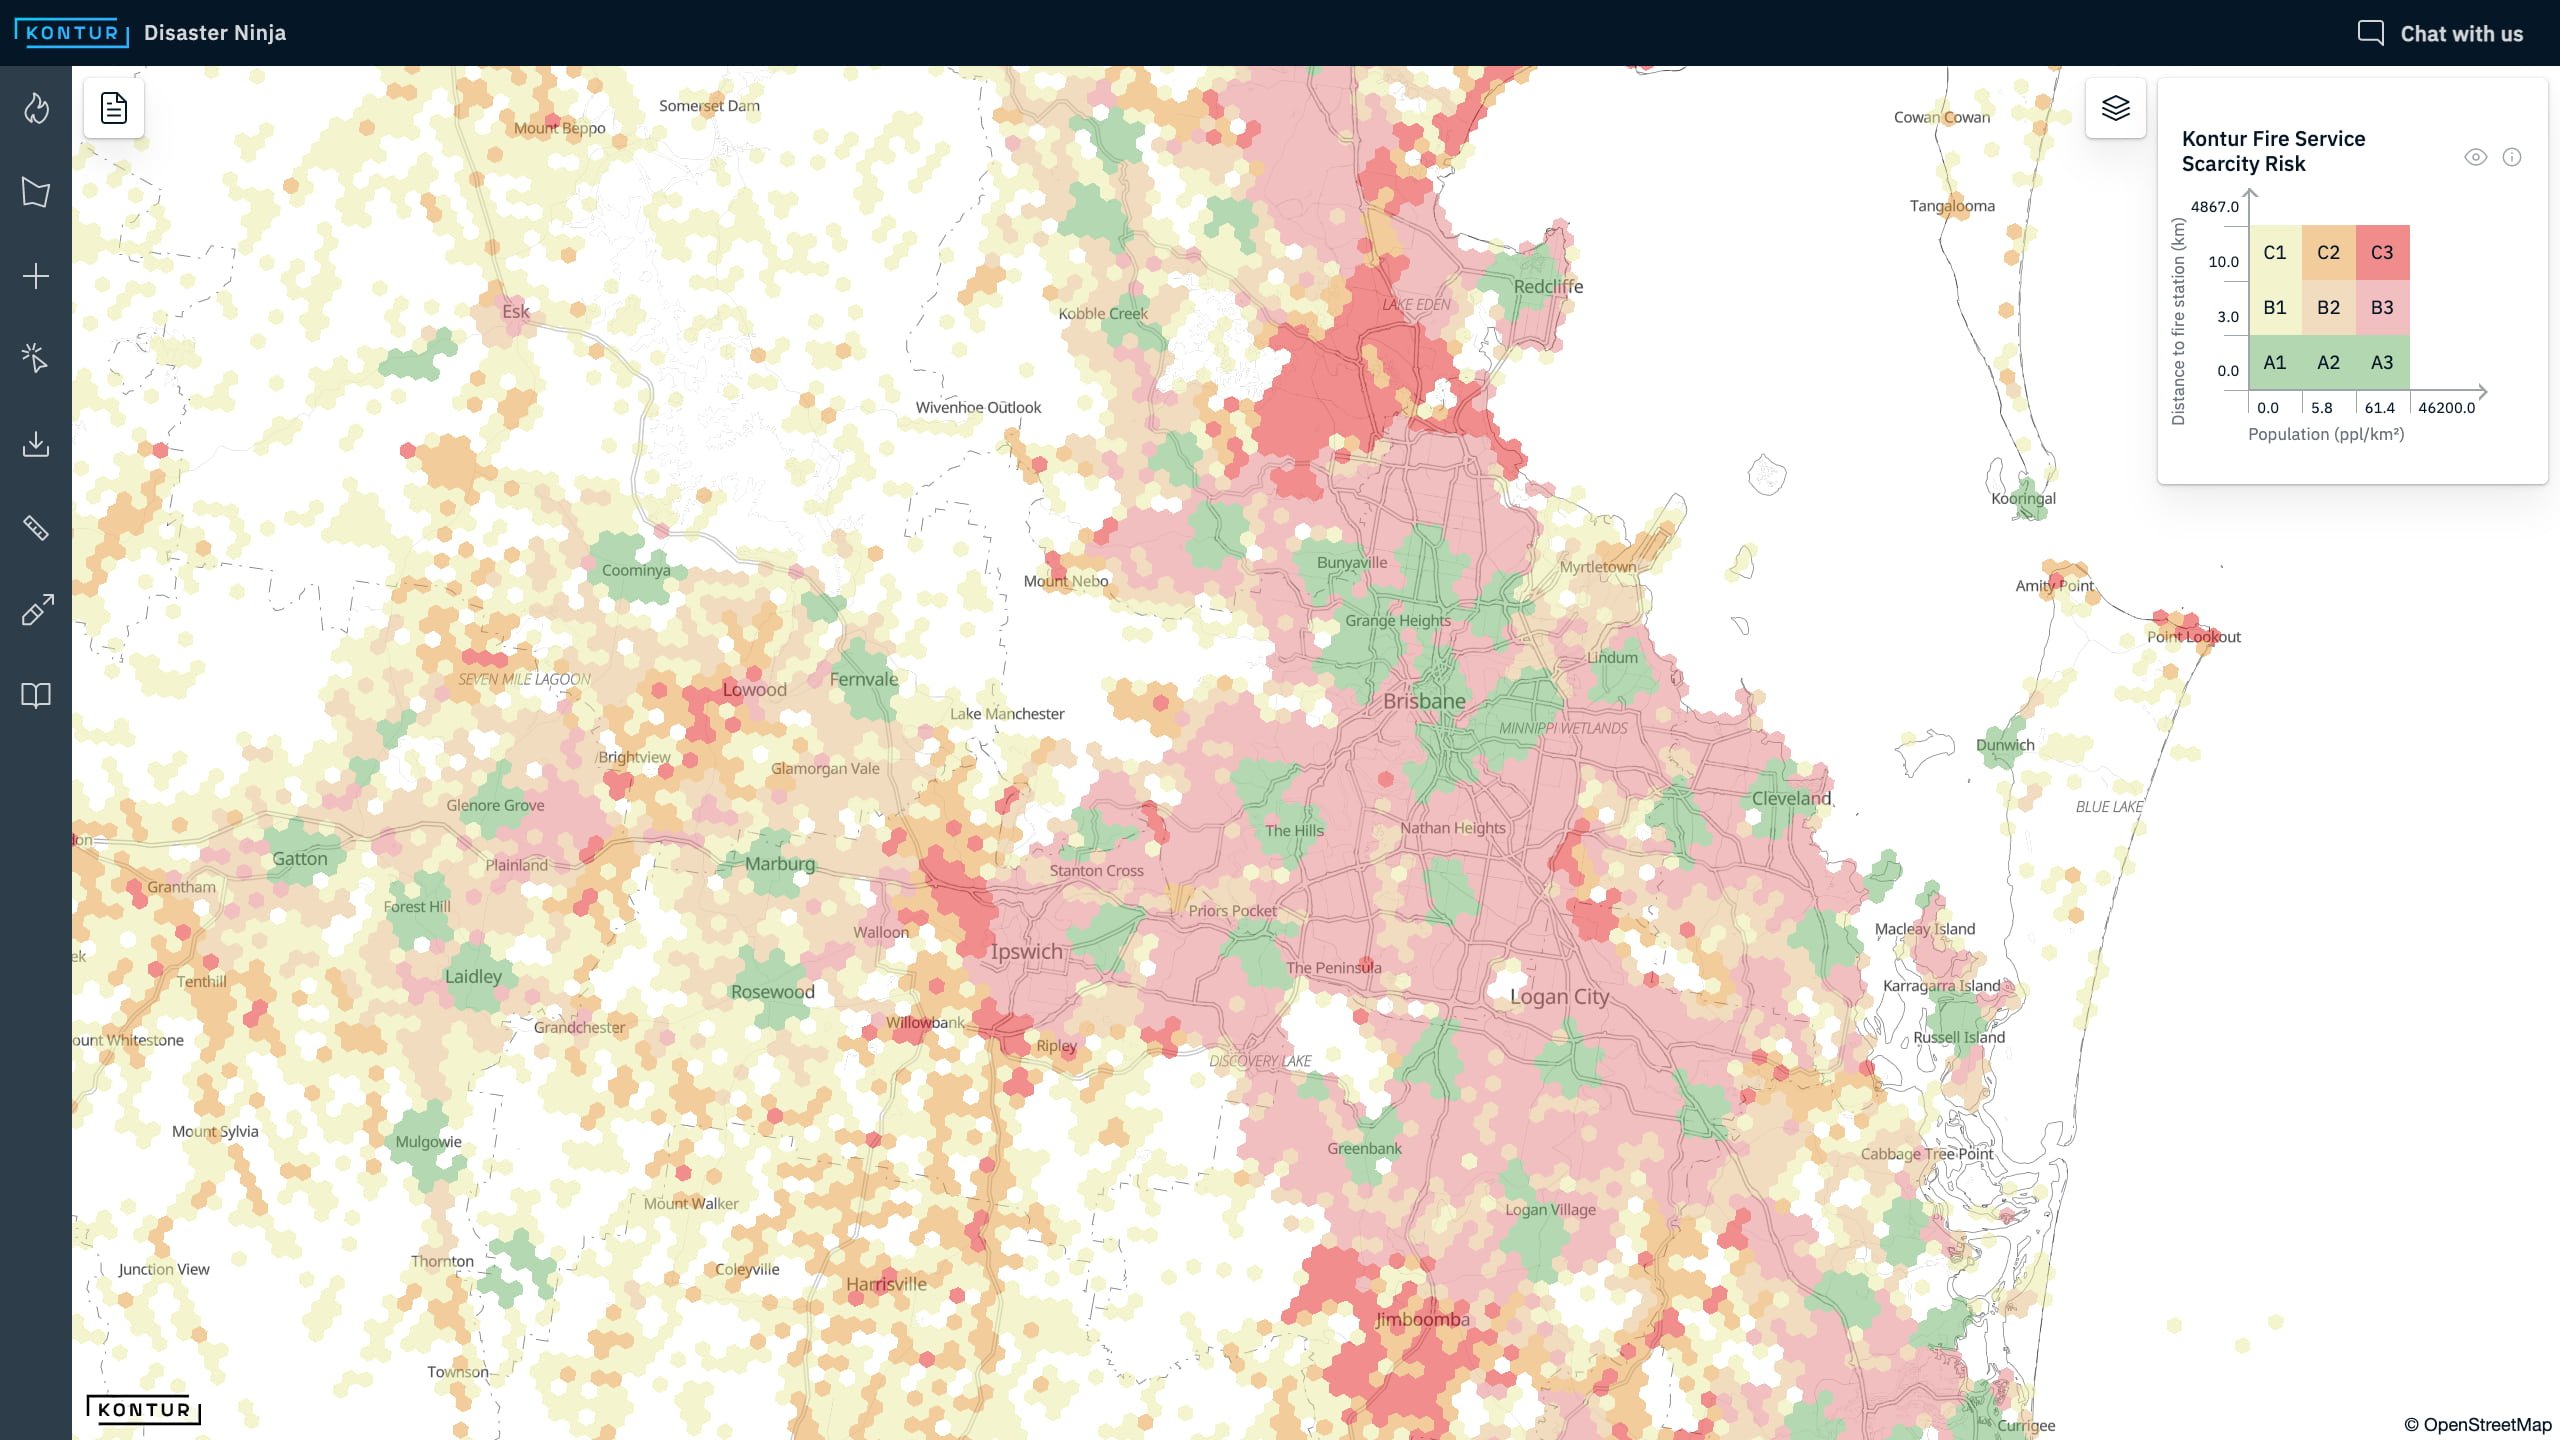
How do you make sure a city has enough fire station capacity for safe functioning? We produced a Kontur Fire Service Scarcity Risk map to perform such an analysis. The map is based on data from OpenStreetMap and shows the areas of a city most likely to experience a lack of fire trucks or fire stations. This information helps convince the city authorities that the number of fire trucks/stations they have is not adequate for the city’s needs.
Population Density
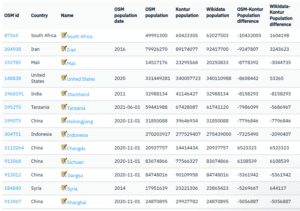
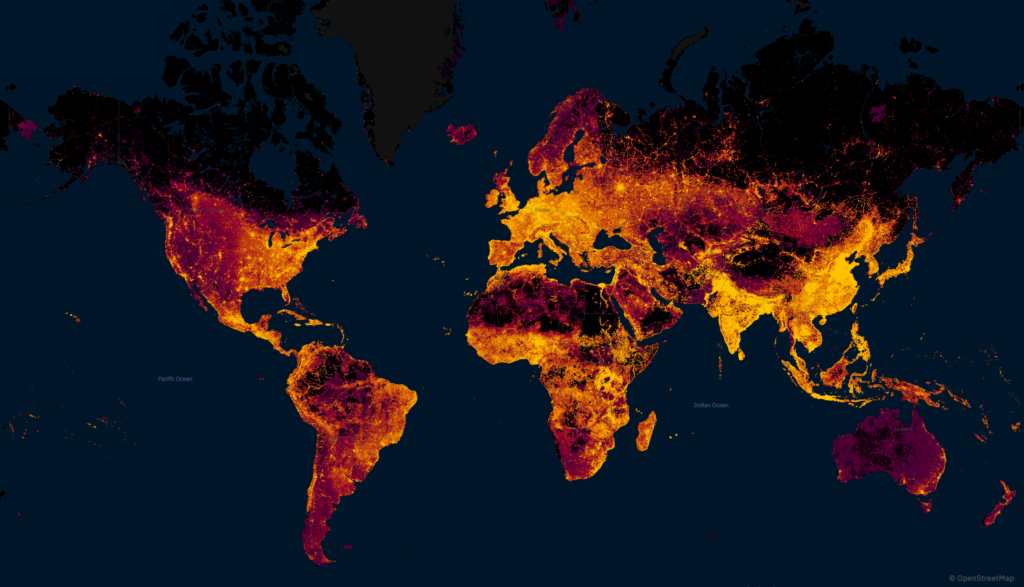
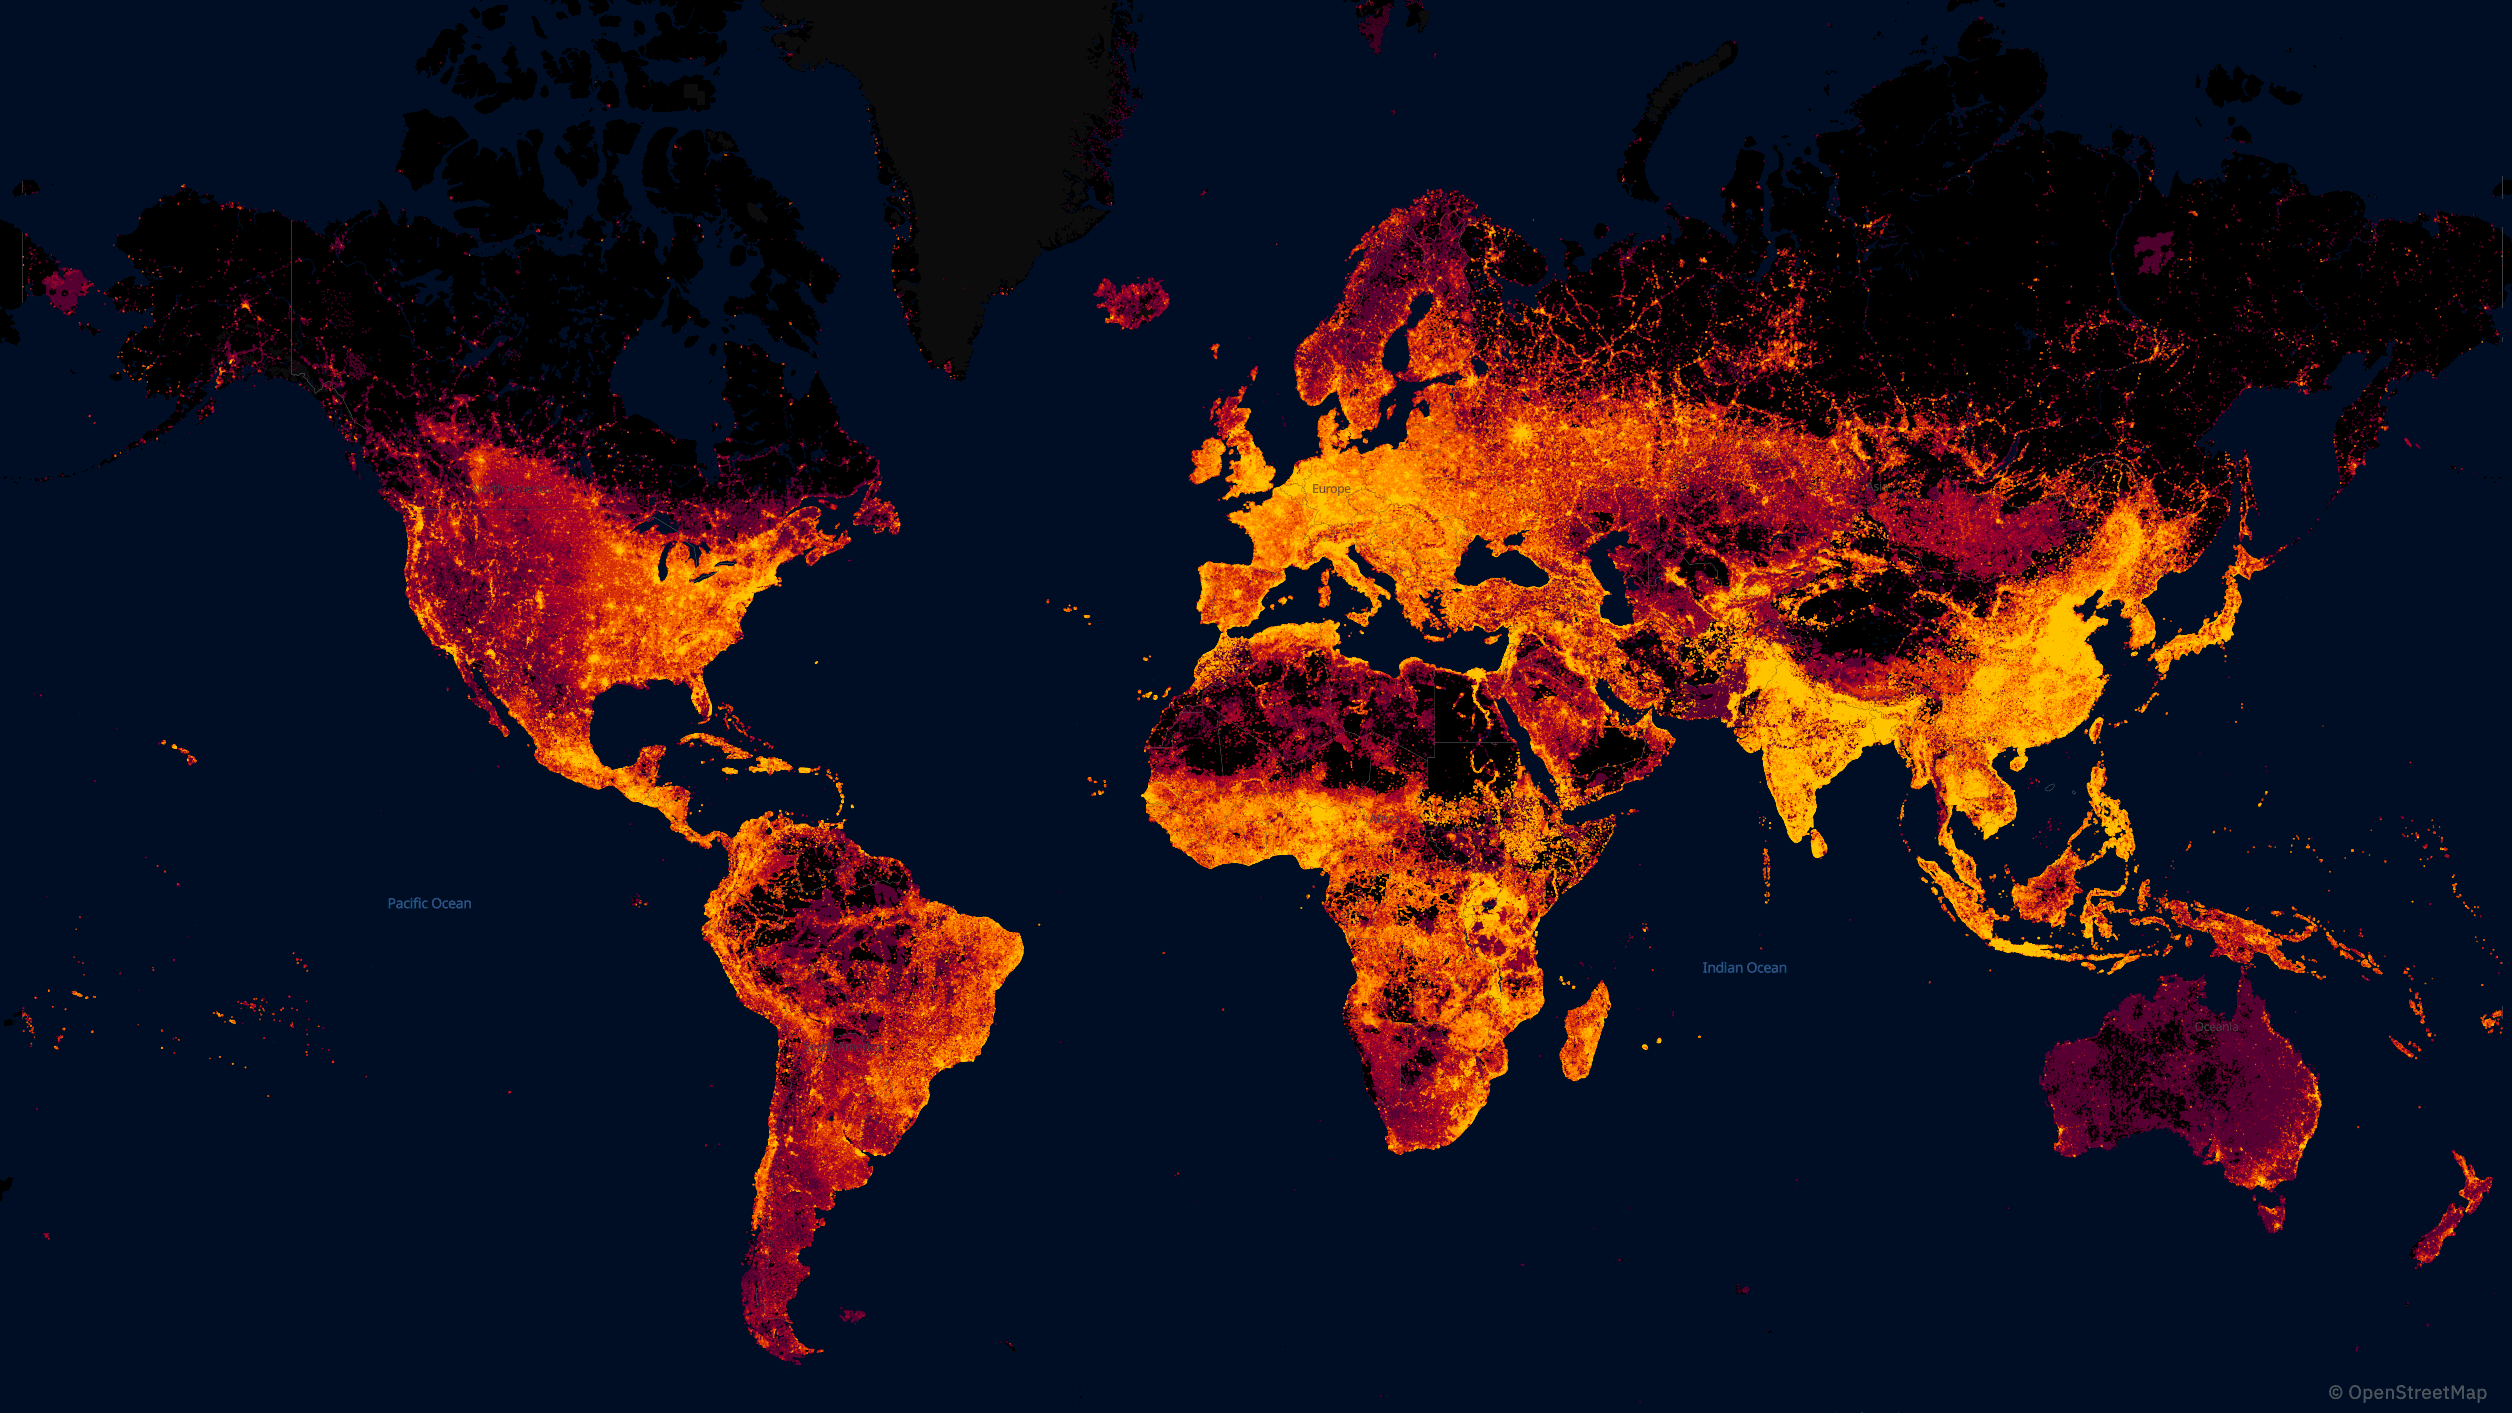
We use Kontur Population as the baseline dataset for our analysis. When planning fire services, it is crucial to know the total population and distribution within a city. In addition, data on the population of the area surrounding the city is also important since the fringe areas may become part of the city.
Kontur Population is built using H3 hexagons. The Hexagonal Hierarchical Spatial Index is used because hexagons have only one distance between a hexagon centerpoint and its neighbors’. This property greatly simplifies performing analysis and smoothing over gradients.
Fire Departments Locations
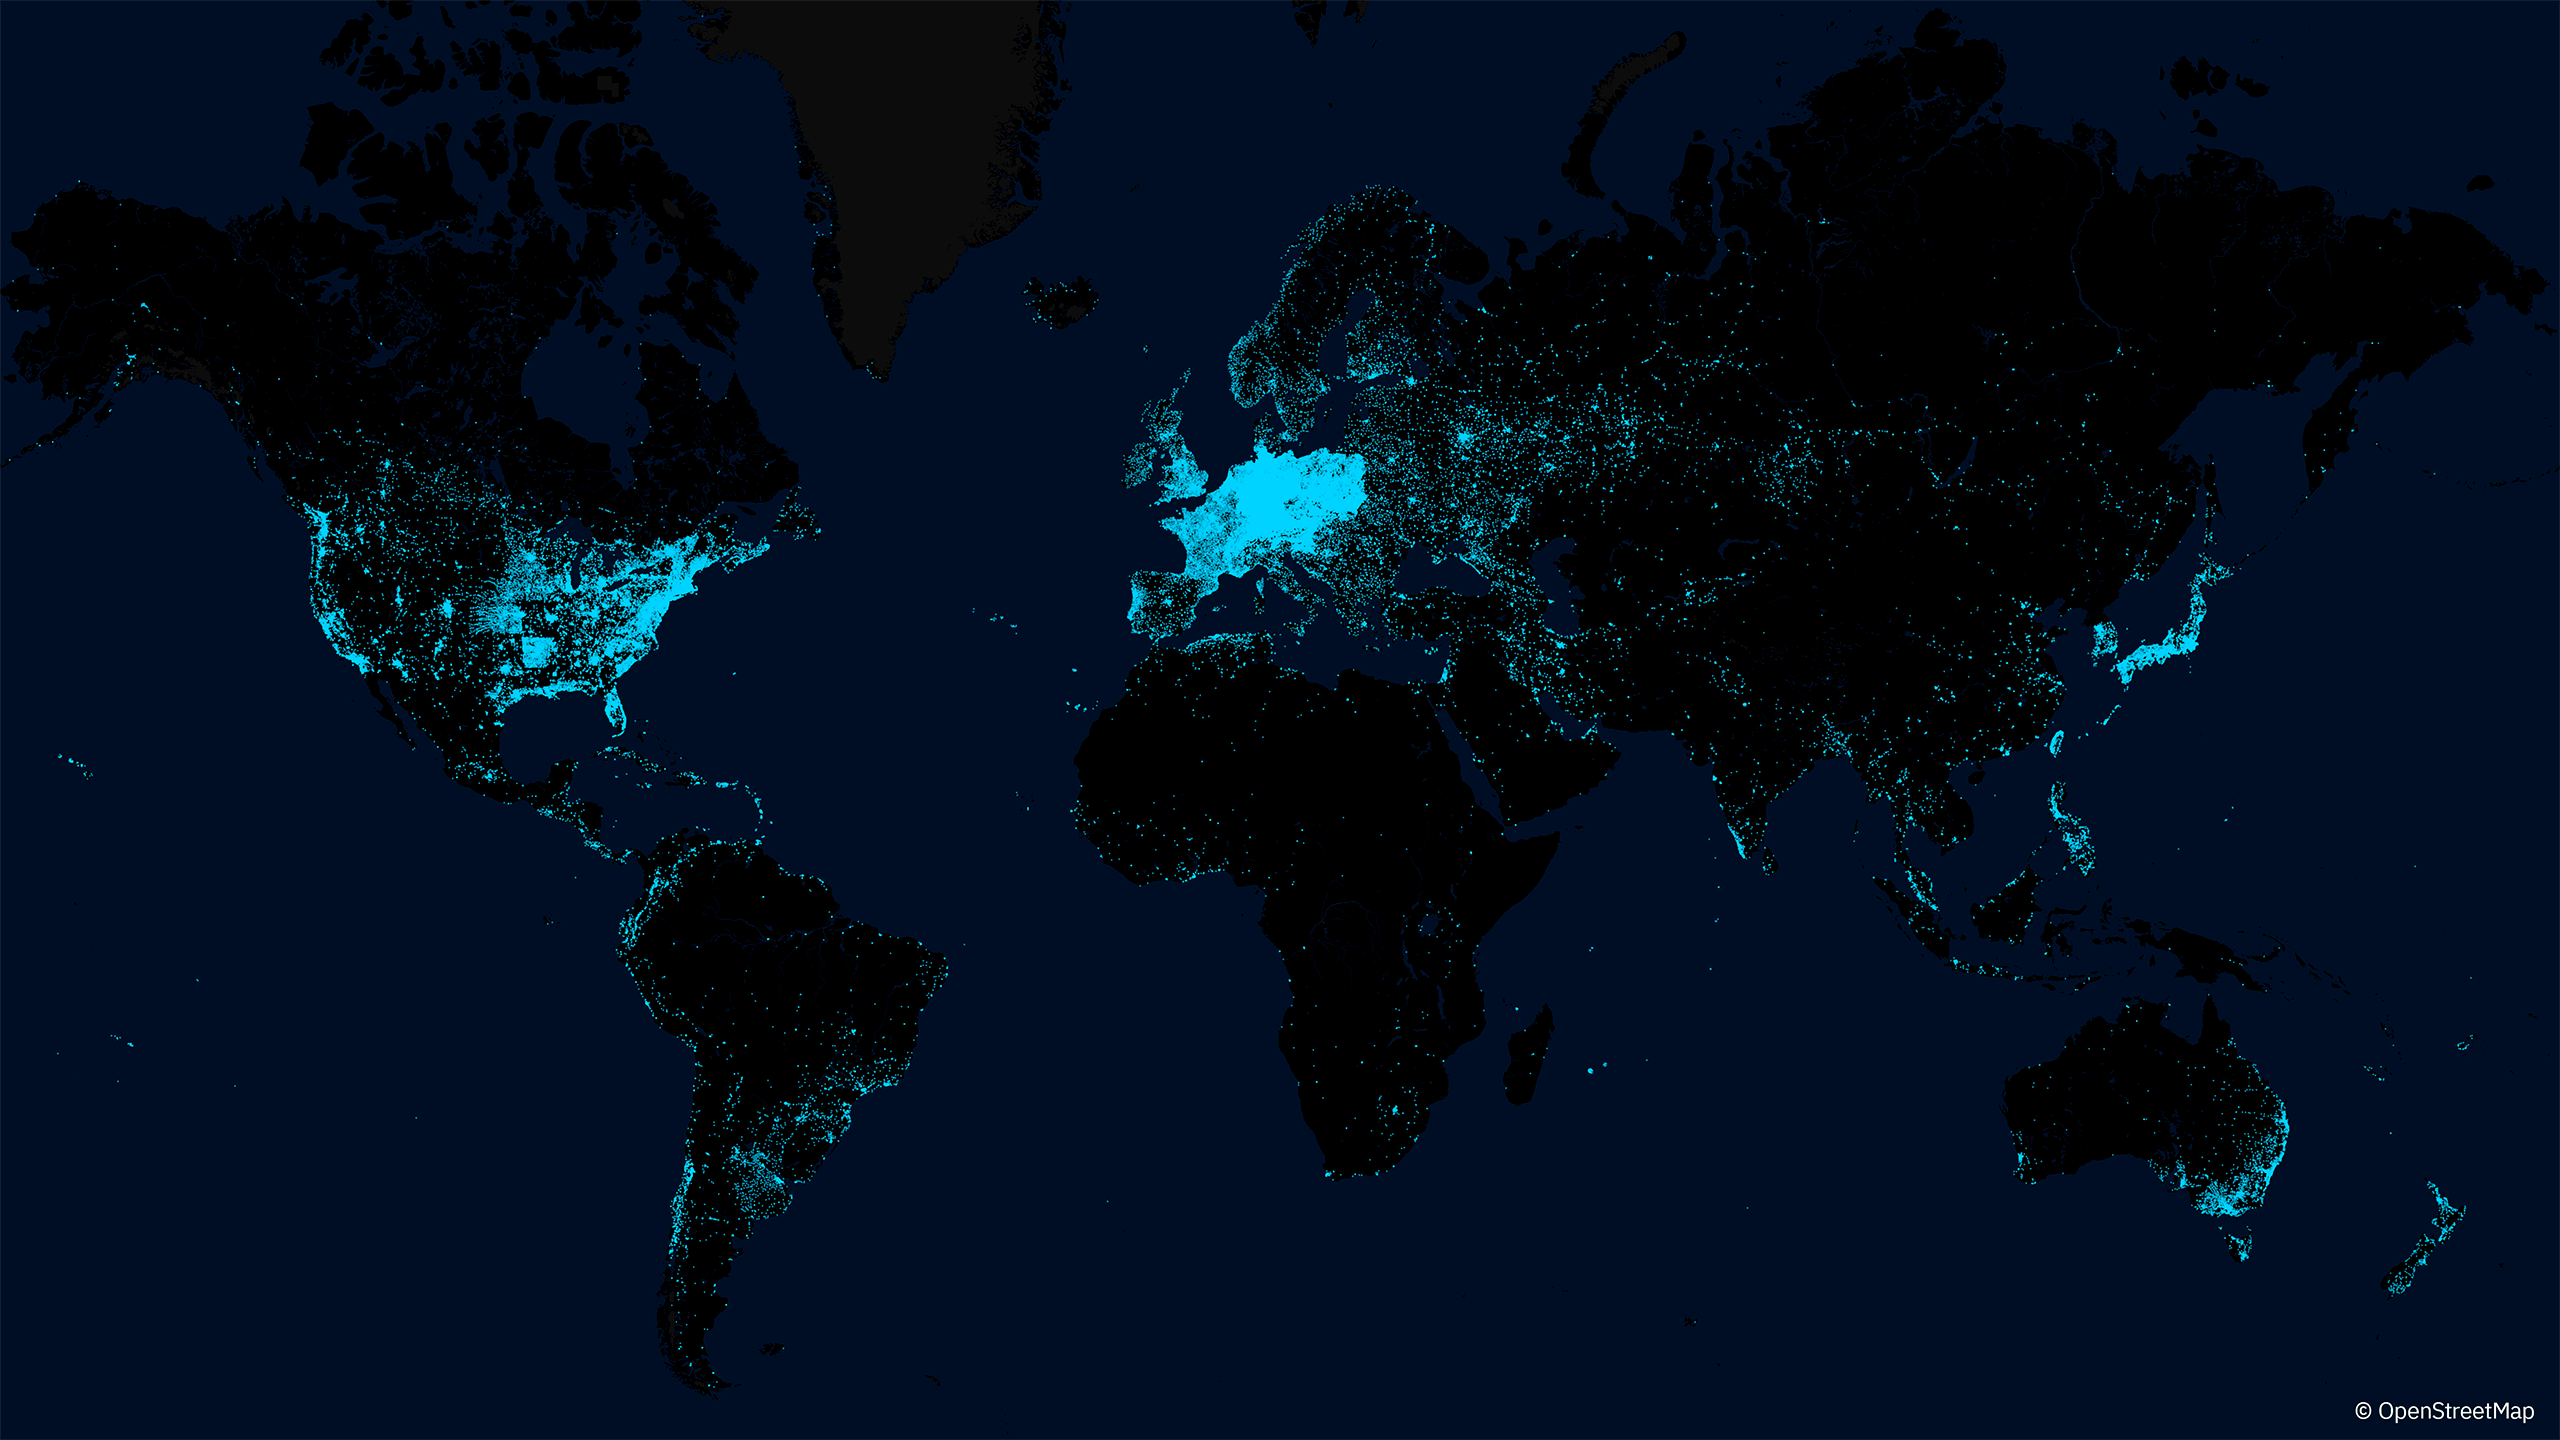
We use data about fire station locations ingested from OpenStreetMap. There are more than 124,000 of them in OSM as of June 2022.
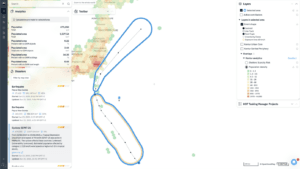
Determining Service Areas
To determine the service area of fire stations, we build an isodistance with a 30 km radius from each of them. To do so, we extract existing car-drivable roads from OpenStreetMap and use the PgRouting router. Next, we calculate the distances in a straight line for areas outside the 30-kilometer zone. Then we determine the maximum distance to the nearest fire station within the boundaries of hexagons at resolution 8 (area less than one km²). After that, we compute the distances for hexagons with roads and/or populations.
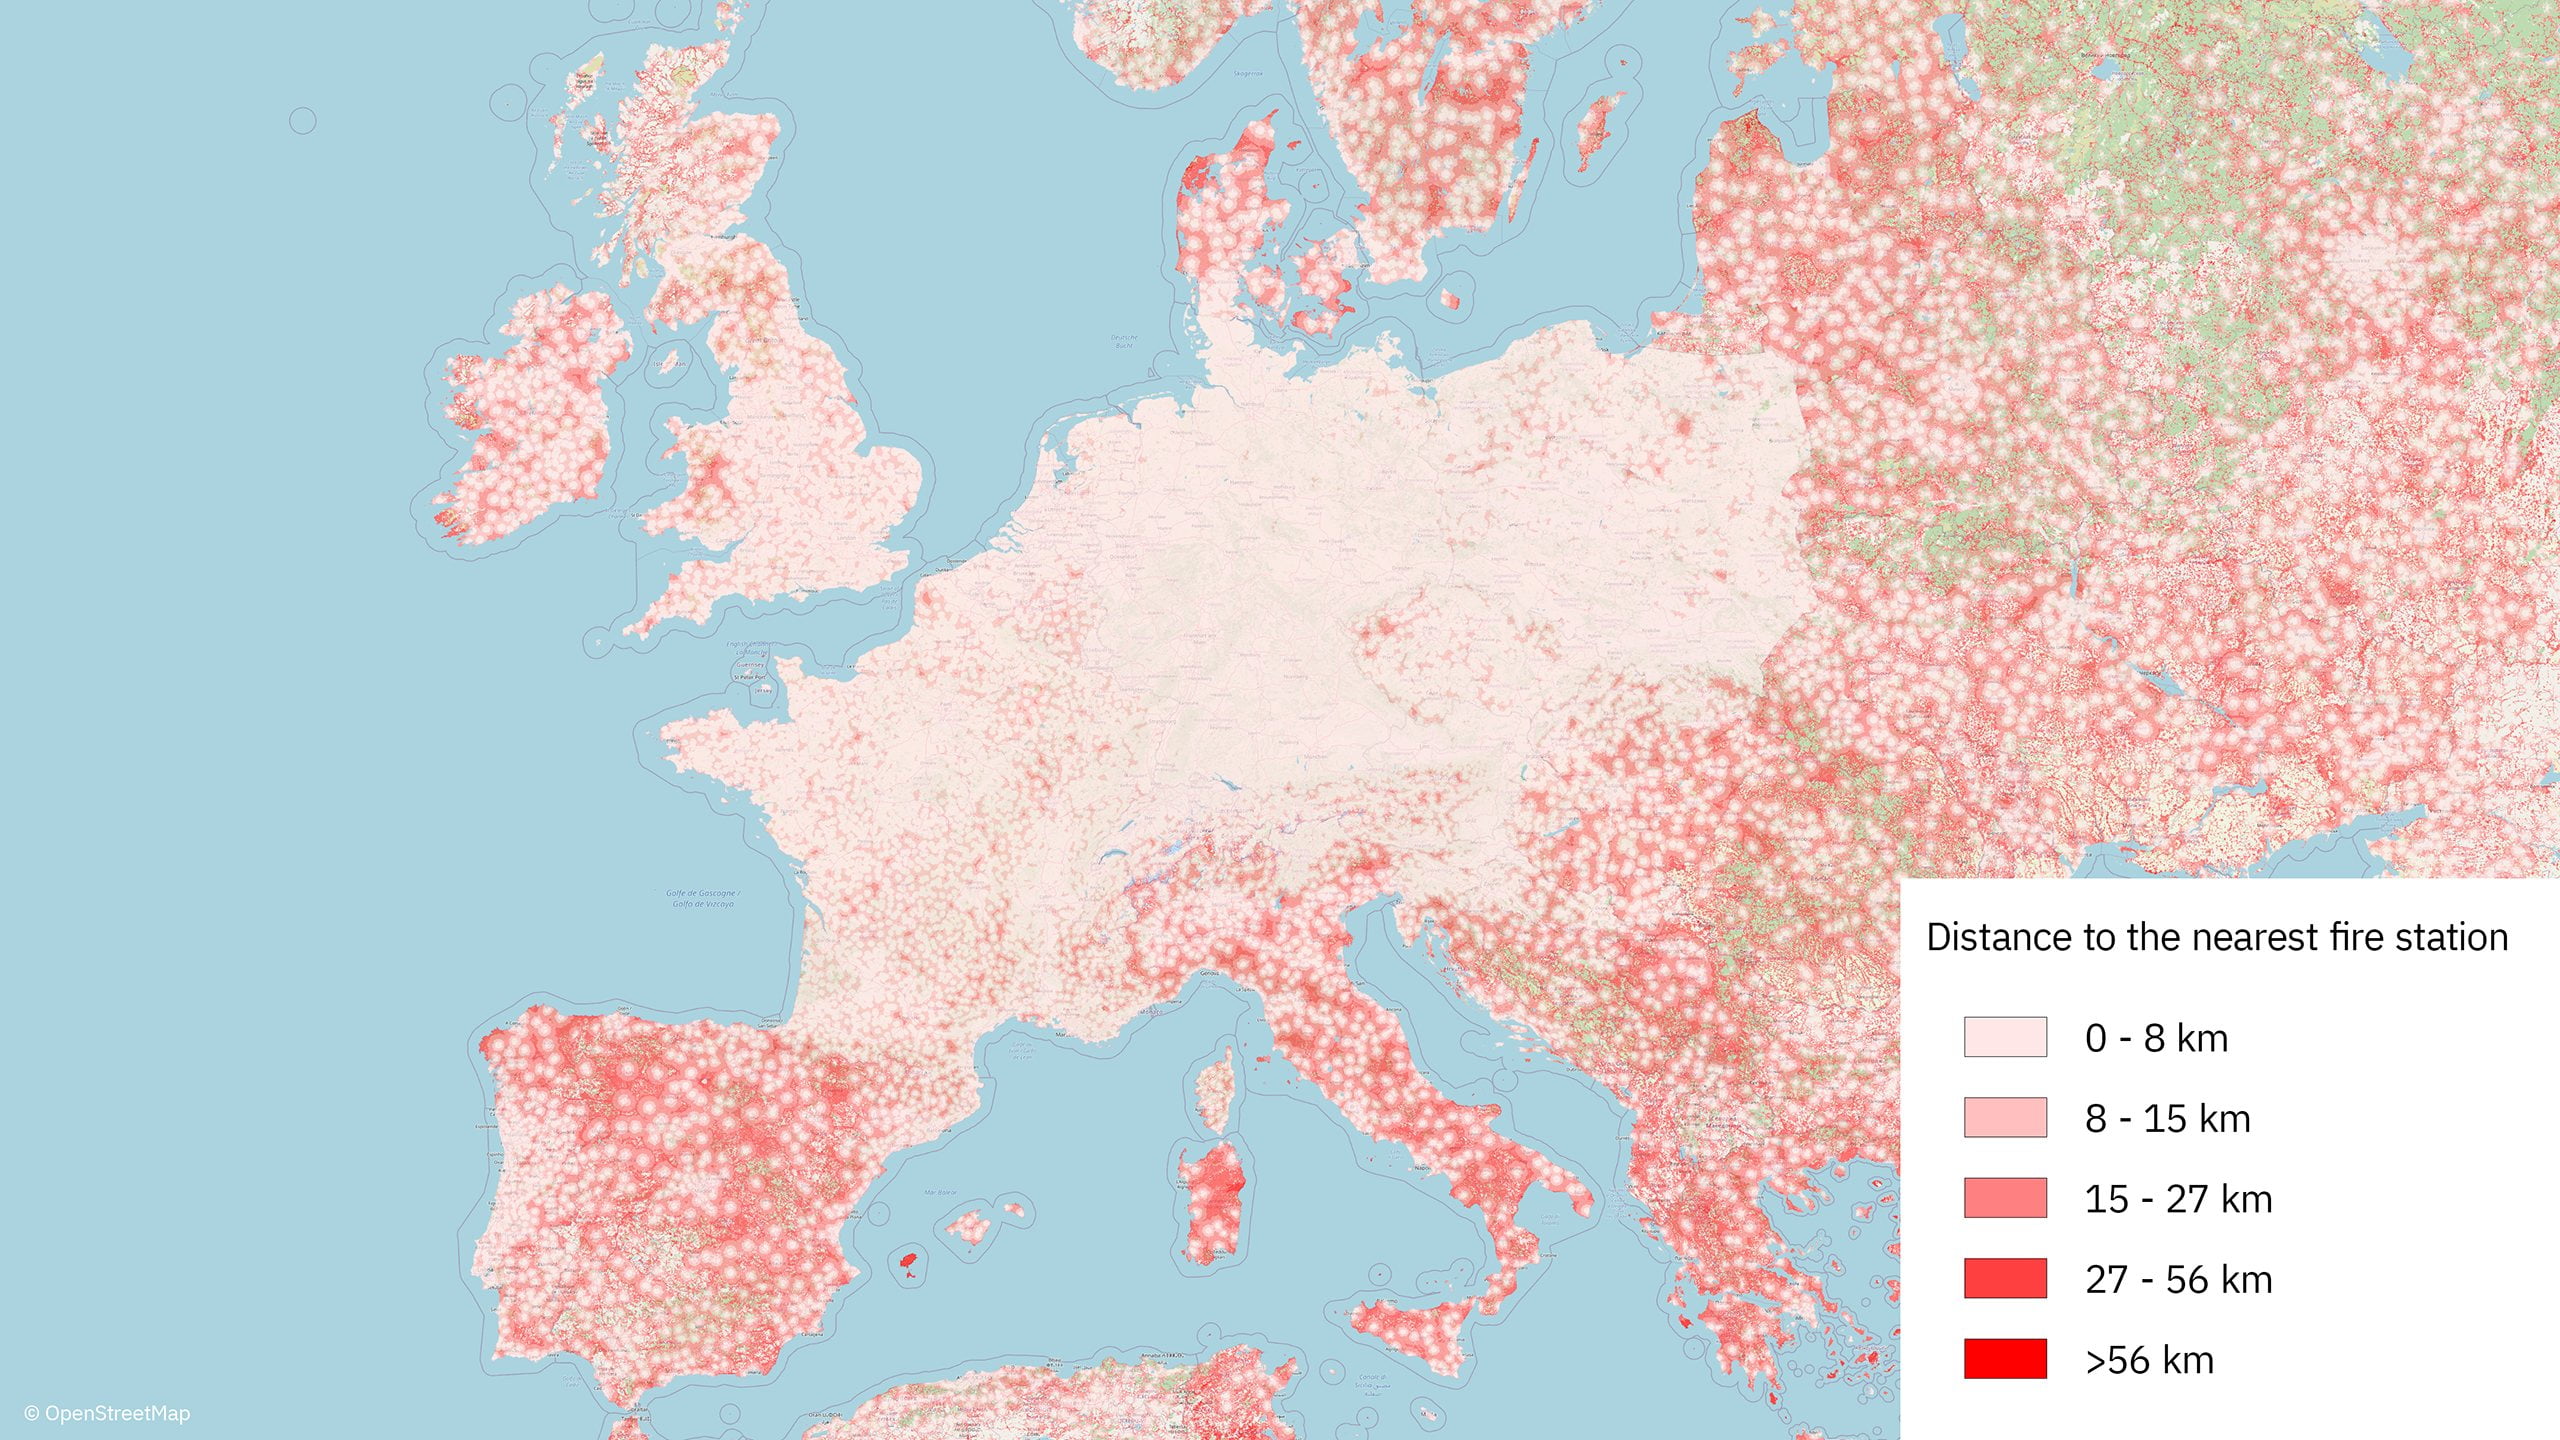
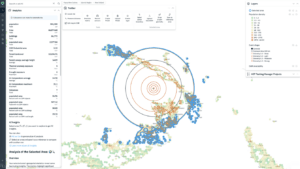
In the next step, we create a two-dimensional map that visualizes both distances to the fire station and population density. We defined a threshold distance from fire stations of 0-3, 3-10, and more than 10 kilometers to determine the coverage areas of each fire station.
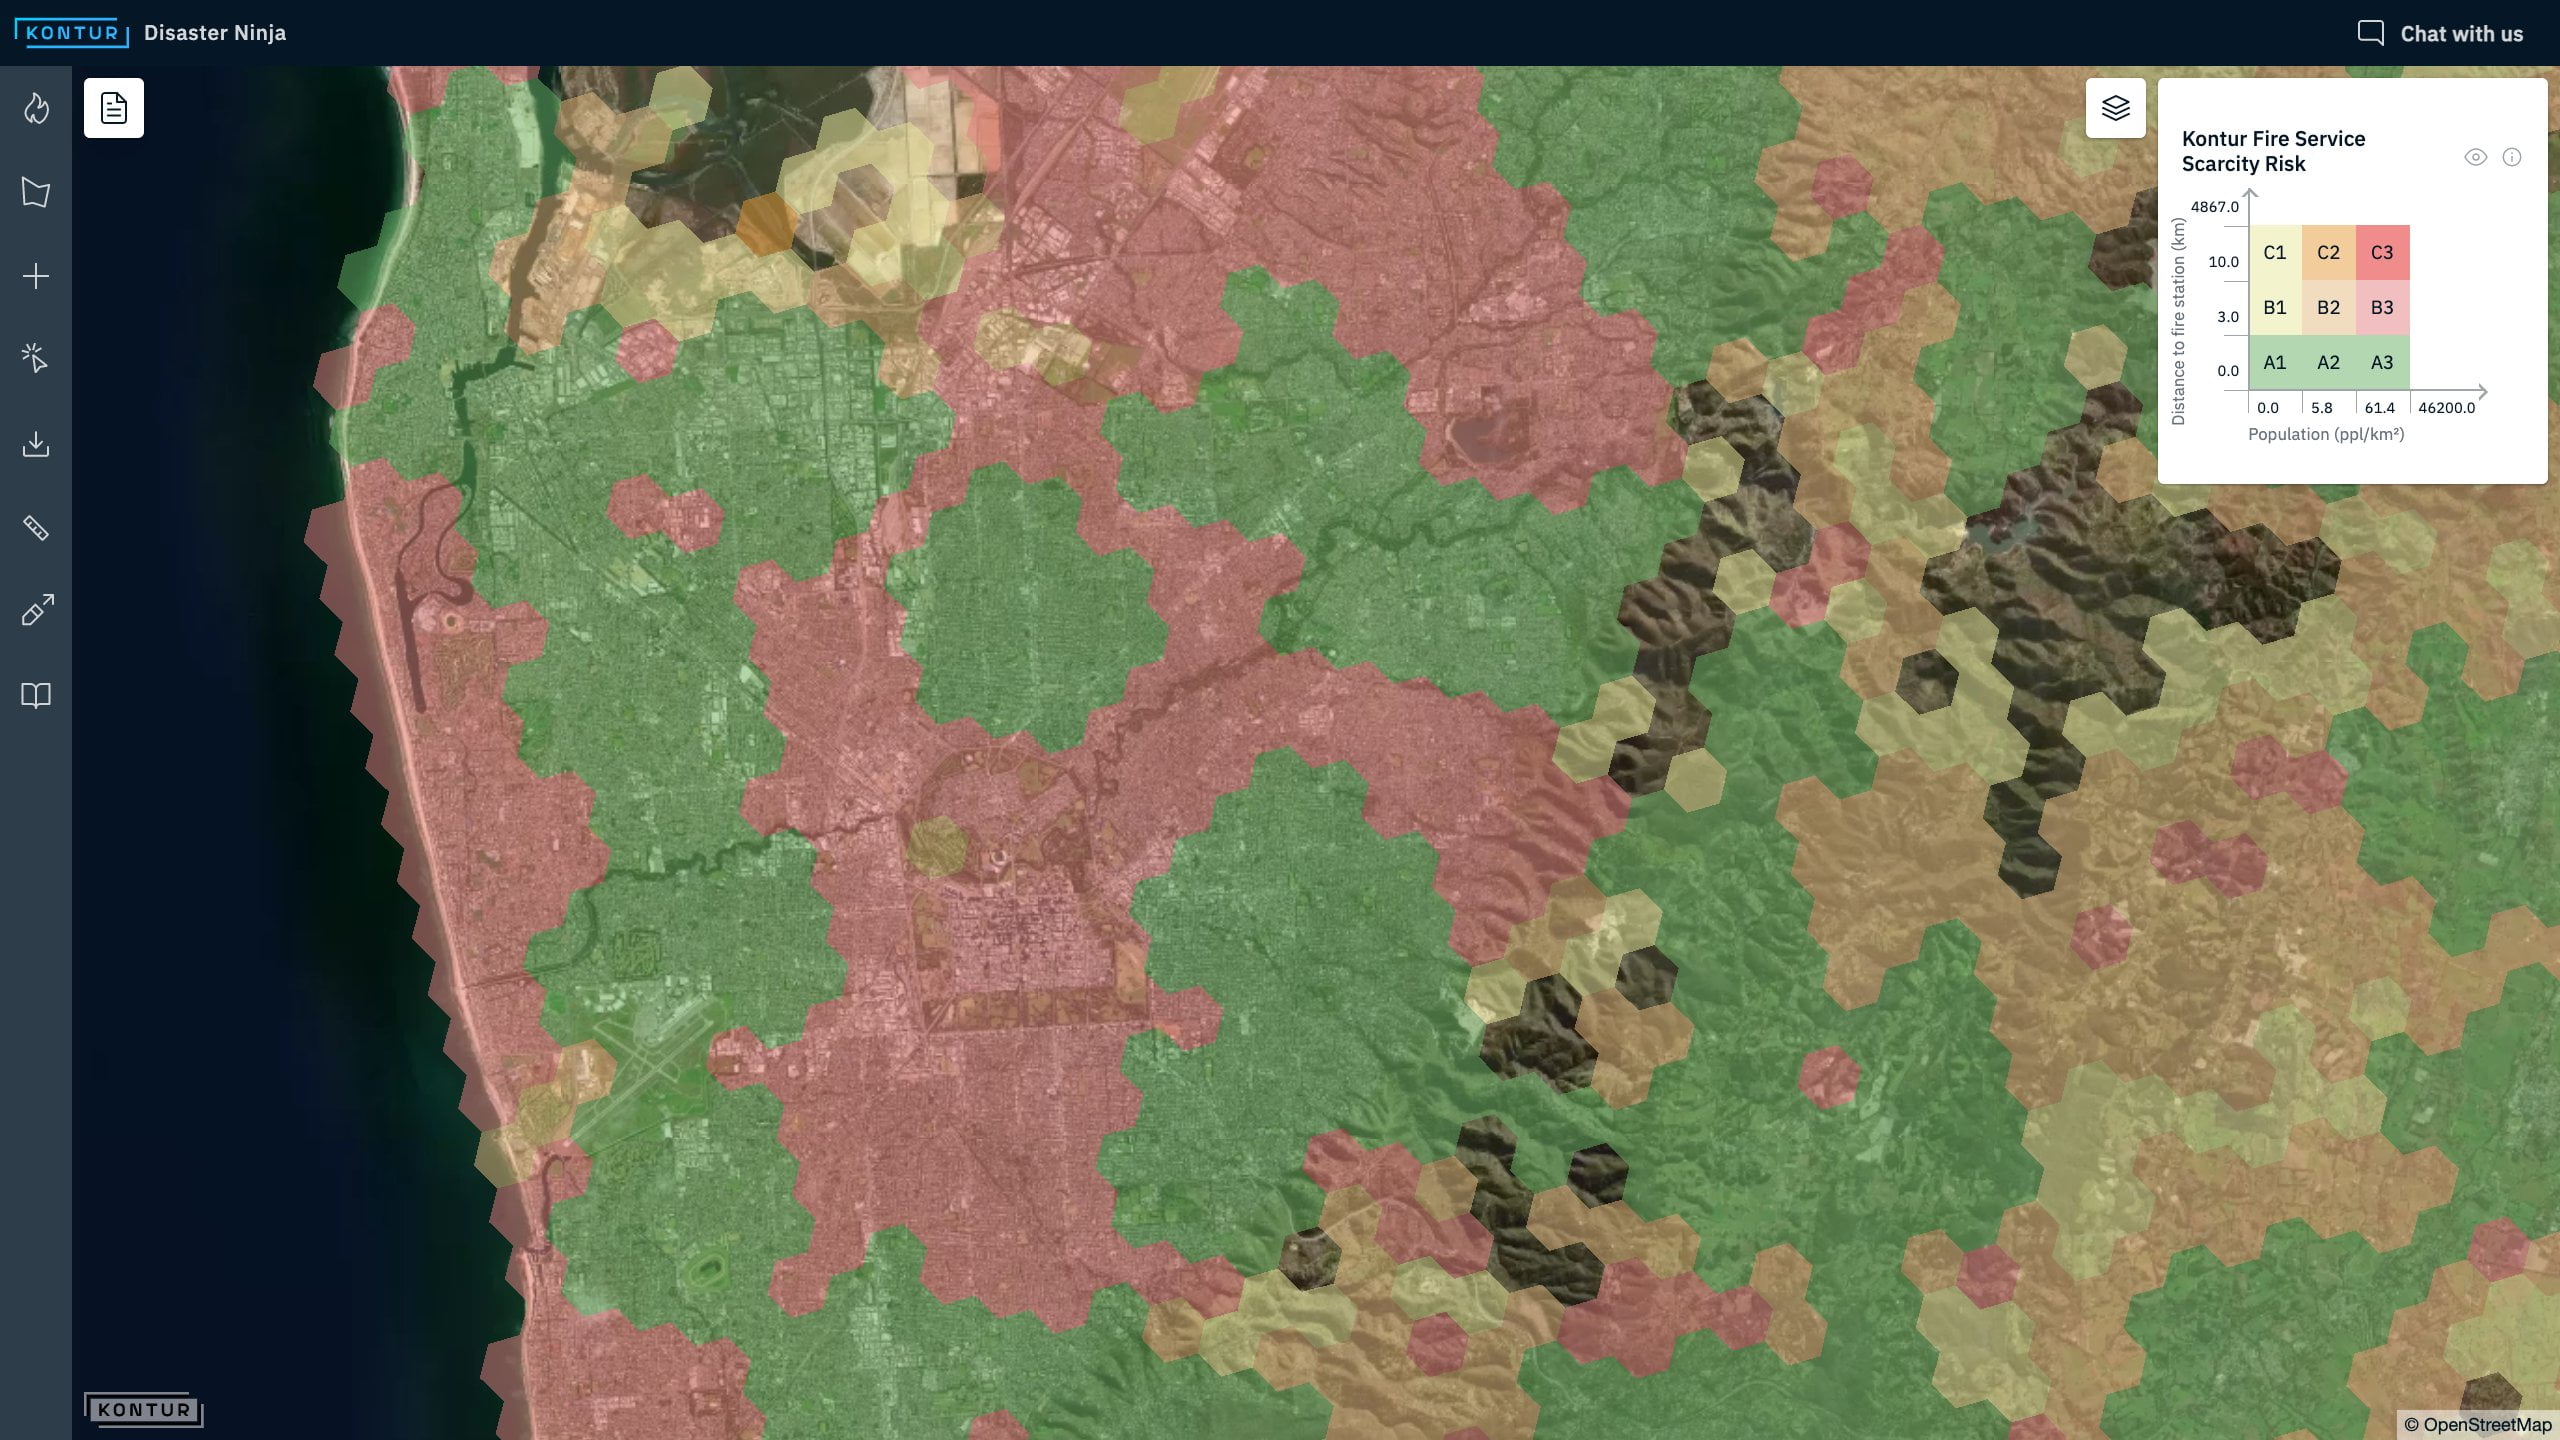
The map gives a clear representation of areas sufficiently covered with fire stations. You need to check if the data is complete in OpenStreetMap for areas identified as underserviced. Anyone can add data there to make it better for free. For a fee, we can do it for you.
Conclusion
Risk management, preparedness, and mitigation have become more crucial than ever with the challenges facing fire service nowadays. The placement of fire stations and equipment dramatically impacts the effectiveness and efficiency of services provided by the fire department.
Kontur Fire Service Scarcity Risk map helps indicate the lack of fire stations. We produce other risk maps too. For example, a similar map exists for healthcare facilities and can be replicated for other urban services. Contact us if you need a custom solution to achieve your goal.
Links
Kontur Fire Service Scarcity Risk – a mapshowing the areas that are most likely to experience a lack of fire trucks or fire stations.
Kontur Population – global population density dataset with counts at 400m resolution. Contact us if you need custom processing or a higher resolution version of this dataset.
Global Fires – an interactive map by Kontur visualizing 13 months of wildfires globally.
OpenStreetMap – a collaborative project to create a free editable geographic database of the world.