Disaster Loss Estimation

Disaster Loss Estimation

Kontur uses a machine learning algorithm to compute monetary loss based on historical data and data retrieved from overlaying events’ geometries with Kontur statistical data.

Why we did it?

Estimating losses in the event of a disaster is difficult, and initial loss predictions rarely match the actual costs. We created an algorithm to compute monetary loss based on analytical data using Kontur Platform capabilities. Retrieved loss estimations enrich Kontur Event Feed with instant disaster damage assessment data.

How we did it?

Dataset Preparation

To create a dataset for machine learning model training we merged pairs of historical events from Kontur Event Feed containing the events’ geometries and their monetary toll.

Linear Regression was chosen as a machine learning approach to estimate disaster loss for several reasons. It is easy to interpret and extract the insights and quickly trained.

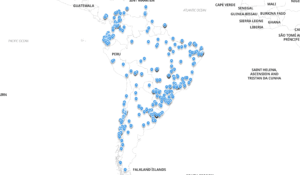
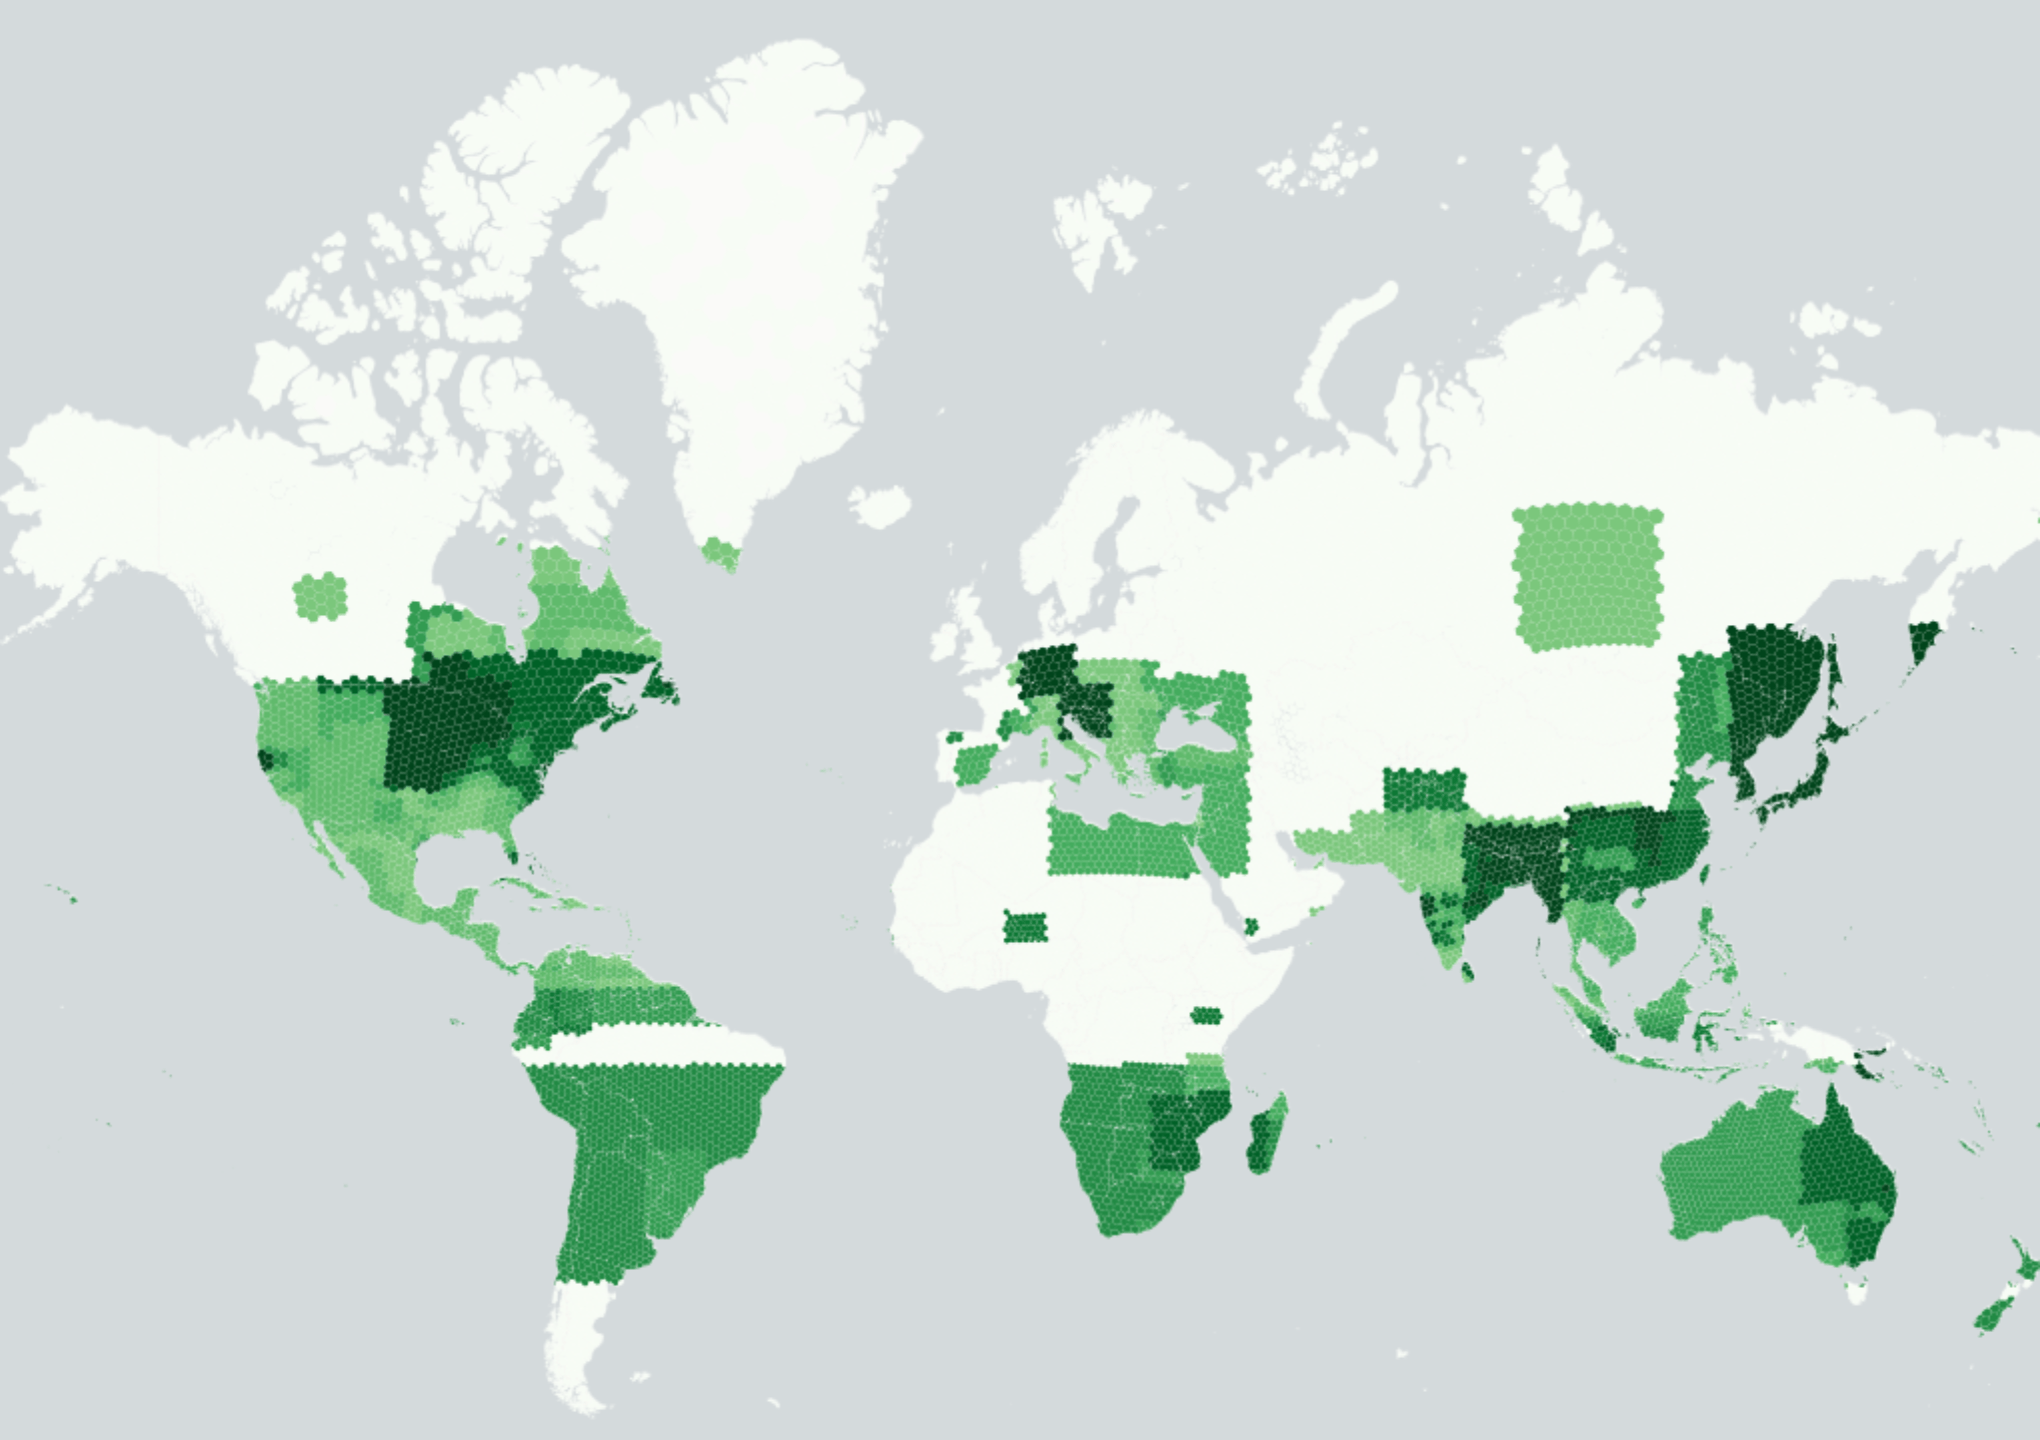
We projected statistical data coming from Kontur’s Insights Engine, including Population Dataset, along with datasets from World Bank, Microsoft, OpenStreetMap, and Meta, to event geometries to retrieve the relation of their features and disaster loss.

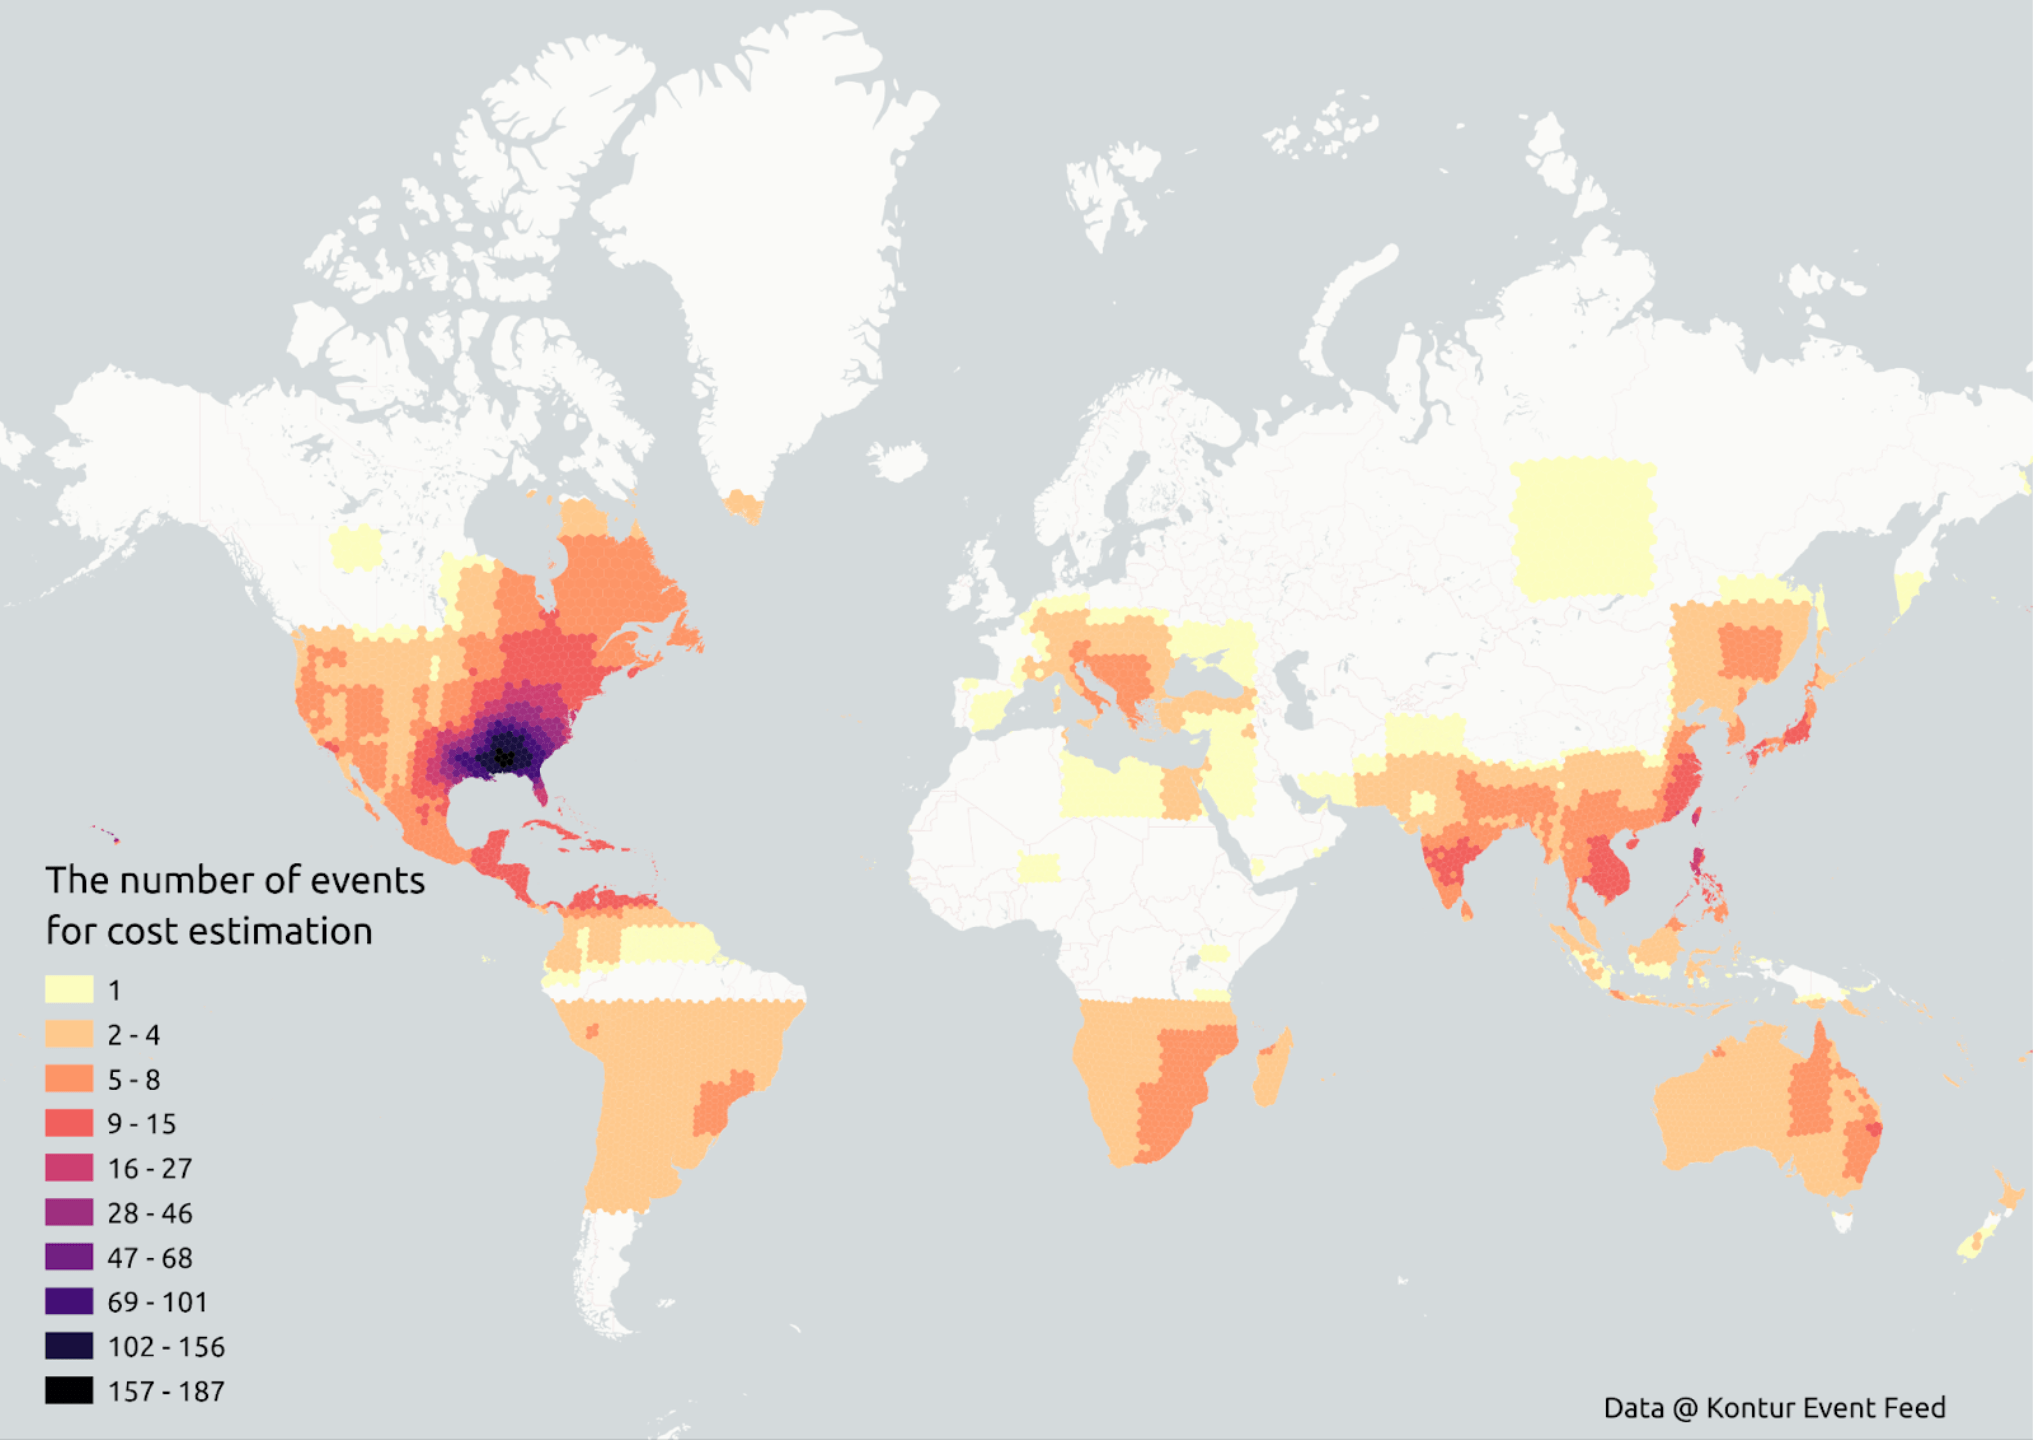
As the result, the following disaster types were covered by the model: floods, wildfires, tornadoes, winter storms, earthquakes, storms, cyclones, droughts, and volcanoes.

Event TypeNumber of Events
Tornado543
Flood398
Cyclone59
Wildfire37
Earthquake25
Winter Storm22
Storm7
Drought6
Volcano5
World coverage of training data used to build the model

Model Accuracy

The data sample’s limits both in coverage and events number resulted in imbalanced estimation accuracy. The highest accuracy score was achieved for estimating tornadoes’ monetary loss due to the greater number of events and their narrower spatial spread. The mean accuracy of loss estimation for this event type is 64%.

Model accuracy (dark – good, light – bad, white – no data)

Prediction Examples

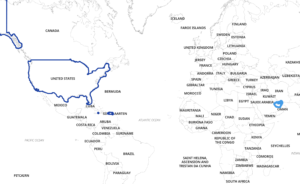
Earthquake – 6.4 Magnitude – 8km South of Indios, Puerto Rico

An earthquake with a magnitude of 6.4 at a depth of 10.0 km occurred 8km South of Indios, Puerto Rico on January 07, 2020, at 10:01:06 GMT, as reported by the National Earthquake Information Center (NEIC) of the USGS.

Predicted cost$1,047,534,900
Actual cost$800,000,000
Accuracy69.1%

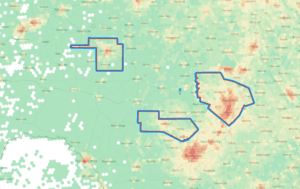
Wildfire – Riverside County (46 Fire), California

A Wildfire (46 Fire) has been reported in Riverside County, California, the United States on October 21, 2019.

Predicted cost$1,141,925,106
Actual cost$1,300,000,000
Accuracy87.8%

Tropical Cyclone – Yaas, India

A tropical cyclone forecast has been issued by Joint Typhoon Warning Center (JTWC) on May 26, 2021, at 09:00:00 GMT. It has impacted Odisha, West Bengal & Jharkhand areas in India.

Predicted cost$2,125,094,231
Actual cost$3,000,000,000
Accuracy70,8%

What’s next?

Kontur’s Disaster Loss Estimation model may become a powerful tool for disaster managers to simulate the impact of critical events or make decisions when they actually happen. It helps assess insurance risks as well.

The prediction accuracy for each event type may be notably improved by ingesting more data for model training.

Leave us a message and we’ll be happy to show a demo of Disaster Loss Estimation and other Kontur Platform capabilities.

Our other projects
Catchment Area Analysis

If you’re in the business of selling goods or services, then you know how important it is to get them to your customers as quickly and efficiently as possible. One useful tool for this is catchment area creation.

Custom Basemaps

Kontur offers specialized basemaps that do not interfere with the display of overlayed colored data.

You can get OpenStreetMap-based map styles made with MapCSS for your products.

Data Services

Kontur offers advanced mapping and data services.

Whether you face logistic challenges having just addresses you have to put on a map or if you have the whole country insured and want to estimate potential risks in case of disaster, we can enrich your data using various Kontur Platform capabilities.

Disaster Ninja

Disaster Ninja lets emergency cartographers prepare mapping tasks in minutes instead of hours.

When a disaster strikes, humanitarian mapping teams face such challenges as choosing the area that needs to be mapped as quickly and accurately as possible. Our interactive dashboard helps save precious time by presenting the event’s details and all available datasets in a succinct, visual form.

Dispatcher 112

Dispatcher 112 app helps dispatchers locate the closest fire stations and send the fire brigades faster to the emergency scene.

The laconic solution includes a typo-proof address search, custom routing algorithm for fire trucks, street length, and roof area measuring tools. The technology works well for the Minsk Fire Dept. and can improve disaster response worldwide.

Event Feed

Get information about changes in the course of events from reputable sources via a simple service and use that to make decisions about people, infrastructure and assets faster.

Global Fires

Global Fires viewer visualizes fire data globally and helps find spots free from smoke pollution during wildfire season.

In case of fire unfolding outside your window, it is vital to know where to find breathable areas nearby. When a threat develops rapidly information should be available at your fingertips. Therefore Kontur has been able to gather information about fires and air quality conditions into a tool available for mobile devices in real-time.

Population Density Dataset

We are building the ultimate publicly available global population dataset by obtaining and processing all available data and fixing all known issues.

It was initially developed as a fundamental part of Disaster Ninja to help Humanitarian OpenStreetMap Team take actions confidently based on data correlated with population density.

Site selection analysis

Site selection analysis is a critical process that involves a comprehensive assessment of potential locations for a business operation, such as a new store, manufacturing plant, or office. It entails gathering and analyzing various factors, such as market socioeconomics, competition, transportation and infrastructure, labor availability, real estate costs, and regulatory environment.

By conducting this analysis, businesses can make informed decisions about where to establish or expand their operations while considering the strengths and weaknesses of each potential area.

Smart City Tools

Kontur offers various tools to empower municipal authorities, urban planners, and businesses with geospatial analytics and situational intelligence for achieving smart city objectives.