Atlas login
by Andrey Sekste and Eduard Kazakov
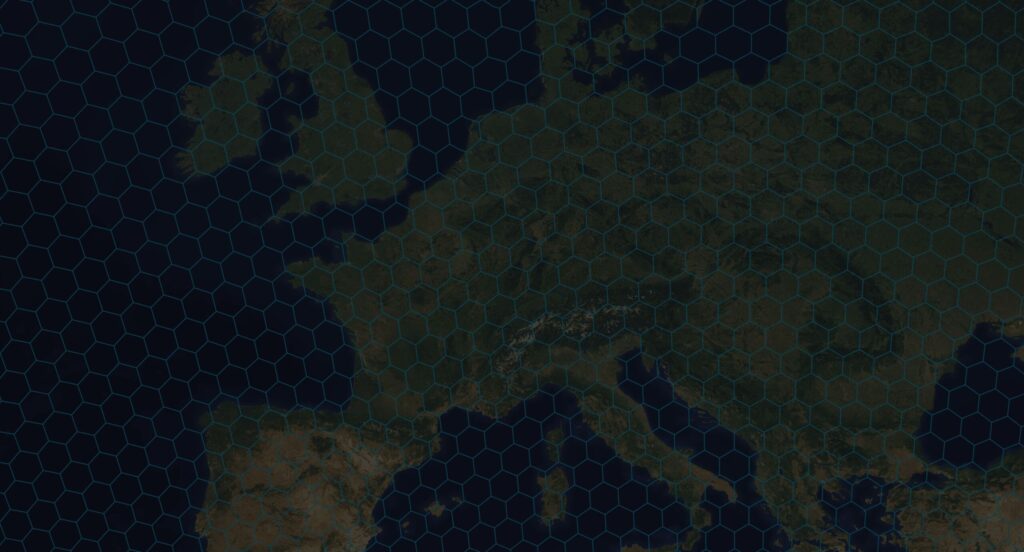
If you have ever opened Kontur’s Disaster Ninja, you have probably noticed that the map of the world – or just any area of your interest – is covered with hexagons. Have you wondered why? In this post, we answer some common questions about the application of hexagonal grids in spatial data visualization and explain what makes them an essential component of our solutions.
What are the ways to represent geospatial data?
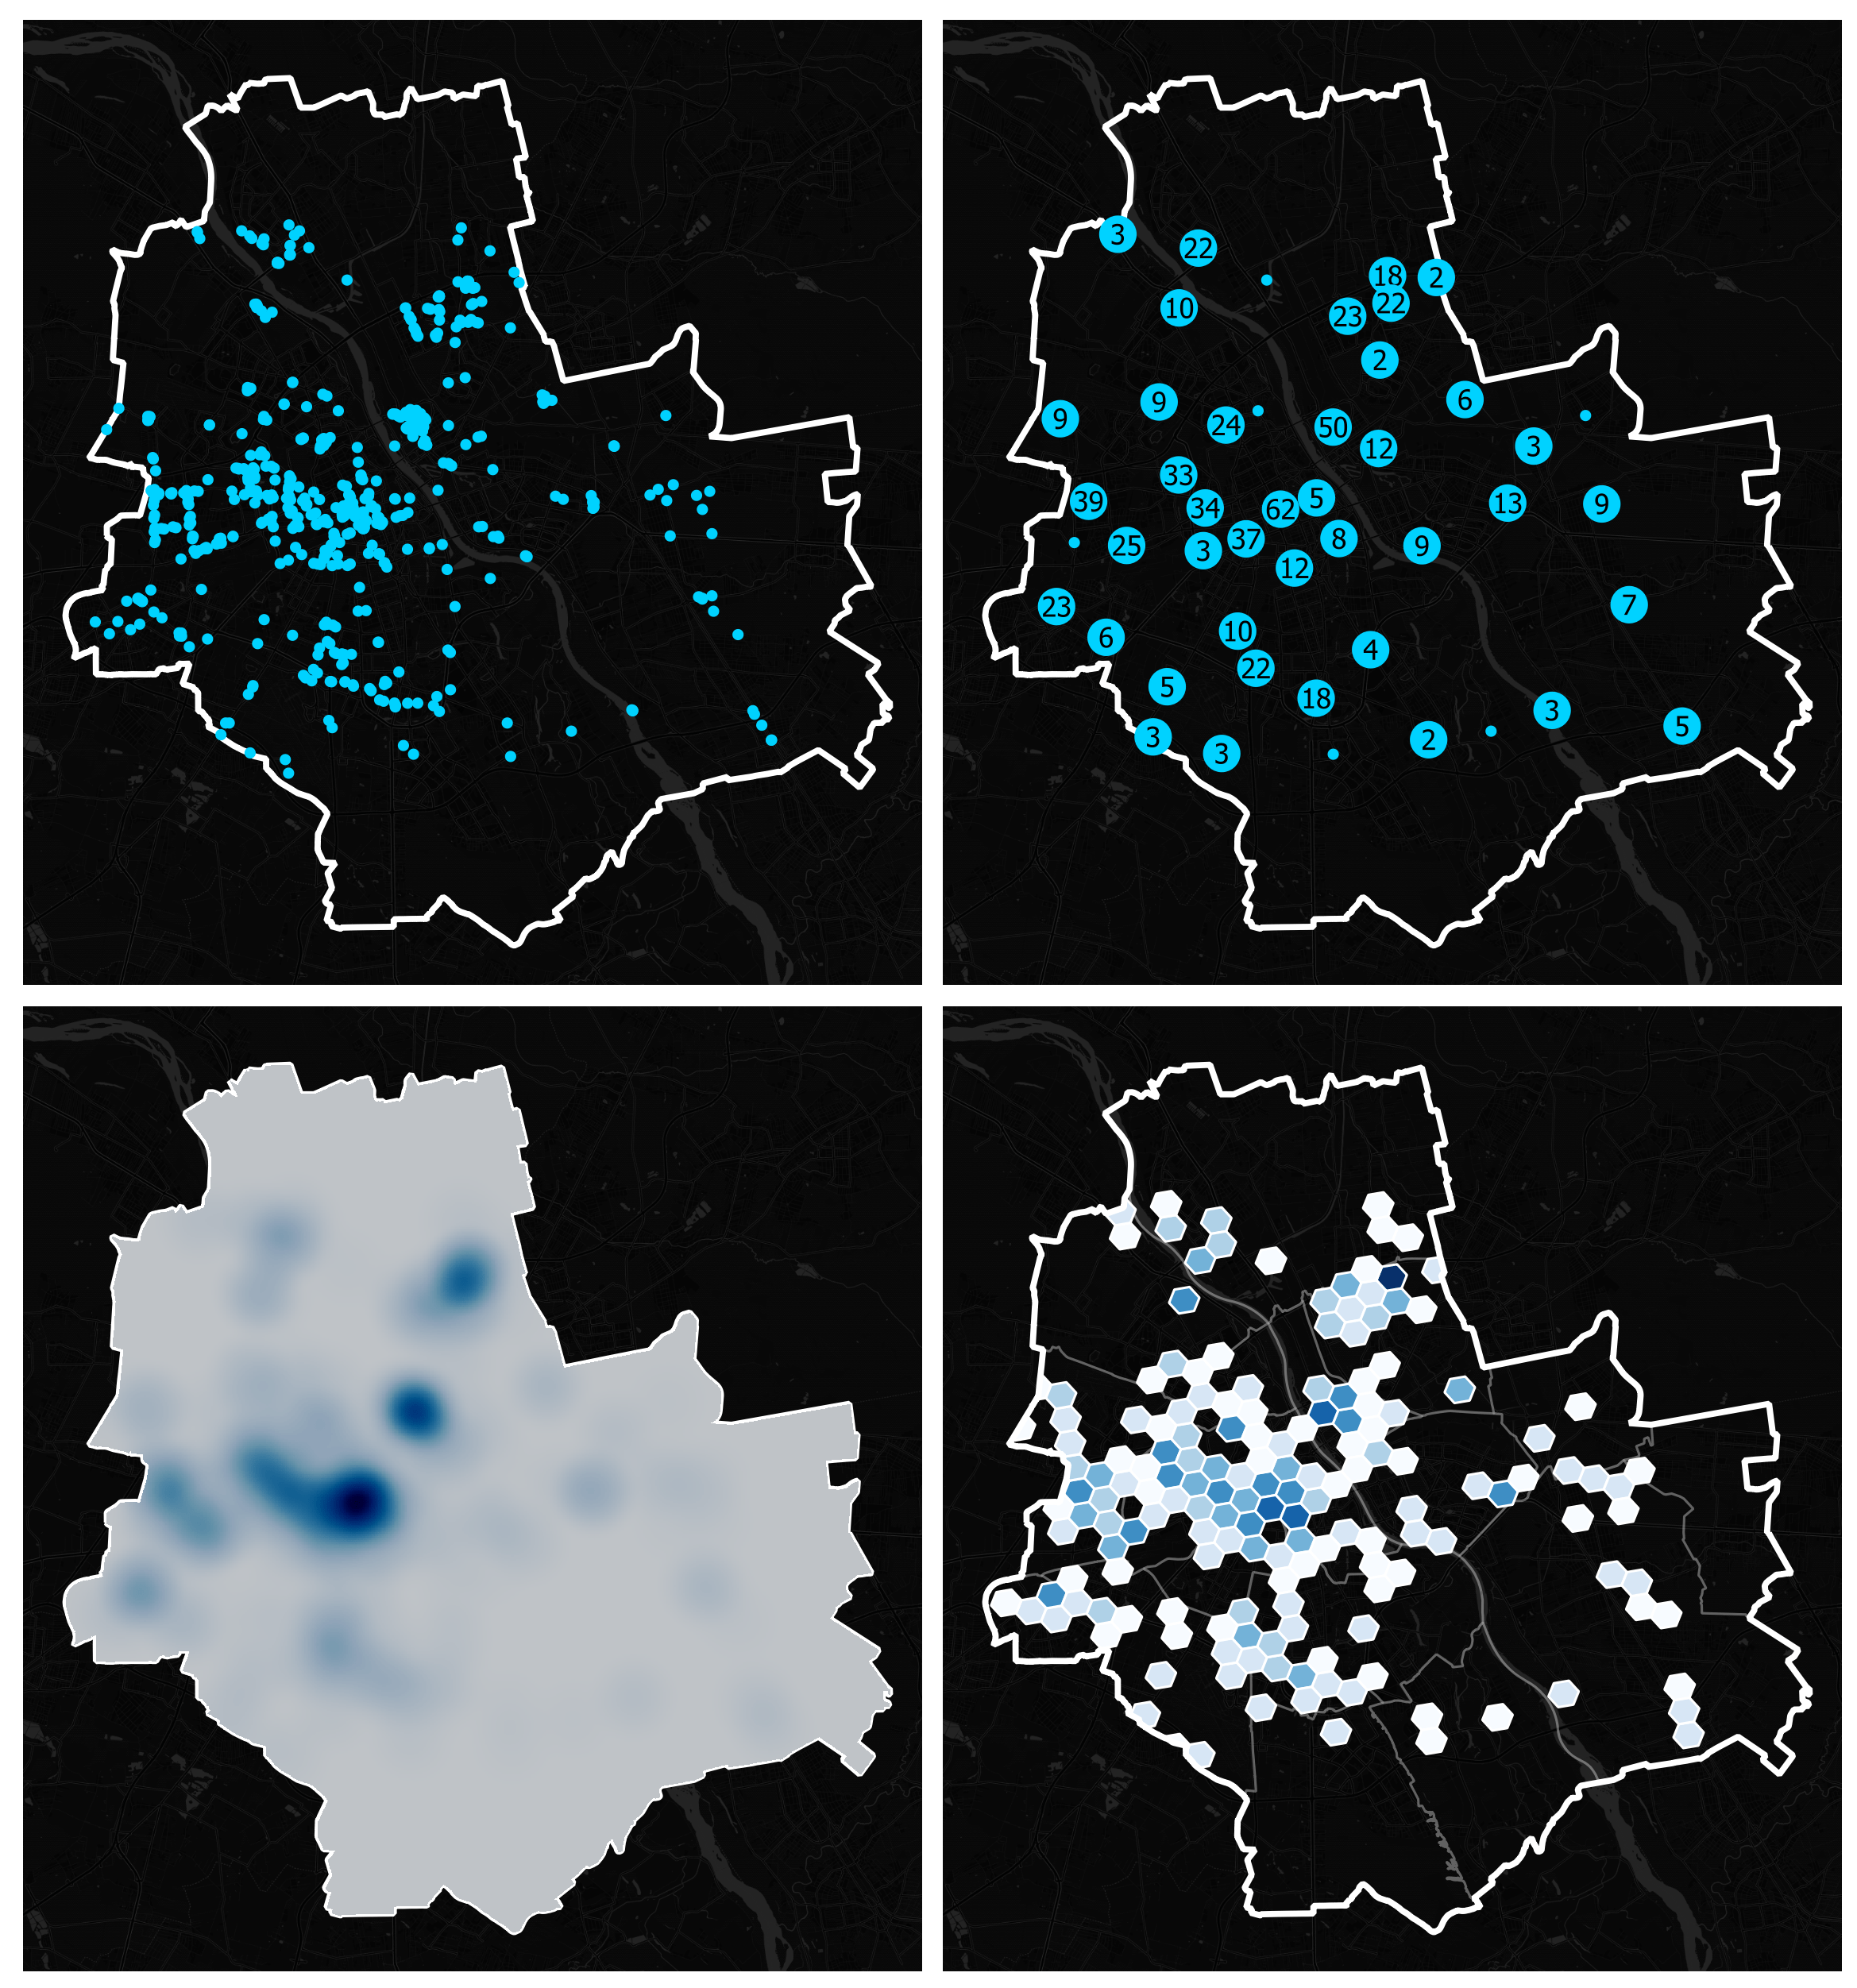
The data that refers to specific locations or geographic areas is often easier to understand if presented visually. It is also helpful for revealing patterns and trends that will lead to relevant decisions. Methods for displaying and analyzing geospatial data are numerous and include, for instance, a point map, a heat map, and a hexagonal binning map.
It can be tricky to visualize a large set of spatial data in a way that will provide relevant information. With a point map, for instance, you can attempt to display each data point with a tiny dot; yet these will inevitably overlap due to the size of the dataset. This approach can be problematic as the actual visual representation may depend on the points’ rendering order – or how the data is stored.
If we are dealing with linear or polygon data, many challenges are coming too – how can we display tens of thousands of roads or millions of building contours? And even if we find how to show them, the next question is: how can we analyze and compare dozens of mixed point, linear, and polygon datasets?
One way to overcome these challenges is by binning the data into a grid with cells of equal size and displaying a single typical value in each cell. Even though you can use cells of different shapes for the binning technique, hexagonal grids have certain advantages described later on, which led us to focus on this data visualization and analysis method in developing Kontur’s solutions.
A hexagonal grid: what is it?
Let’s start with the basics. In geometry, a hexagon is a closed plane shape with six sides. Hexagonal grids consist of regular hexagons where all the sides are of the same length, and each internal angle equals 120 degrees.
You can find hexagons in nature, for instance, in the shape of honeycombs, and they are common in human-built structures and materials that require high strength and low weight simultaneously. Interestingly, hexagonal grids are very popular in the design of board games.
You can use hexagons to evenly cover a surface without overlaps or gaps (the property known as “tessellation”). Even though squares and triangles can tessellate too, hexagons have a crucial advantage: the distance between the center points of any two neighboring hexagons on a grid is always the same. Along with several other benefits, it makes hexagons ideal for geospatial analysis.
Why are hexagons powerful?
The first thing to understand about mapping spatial grids is that real-world maps come with irregular zones, as countries, forests, rivers, and virtually any objects you see on the map have different sizes and shapes that can change over time.
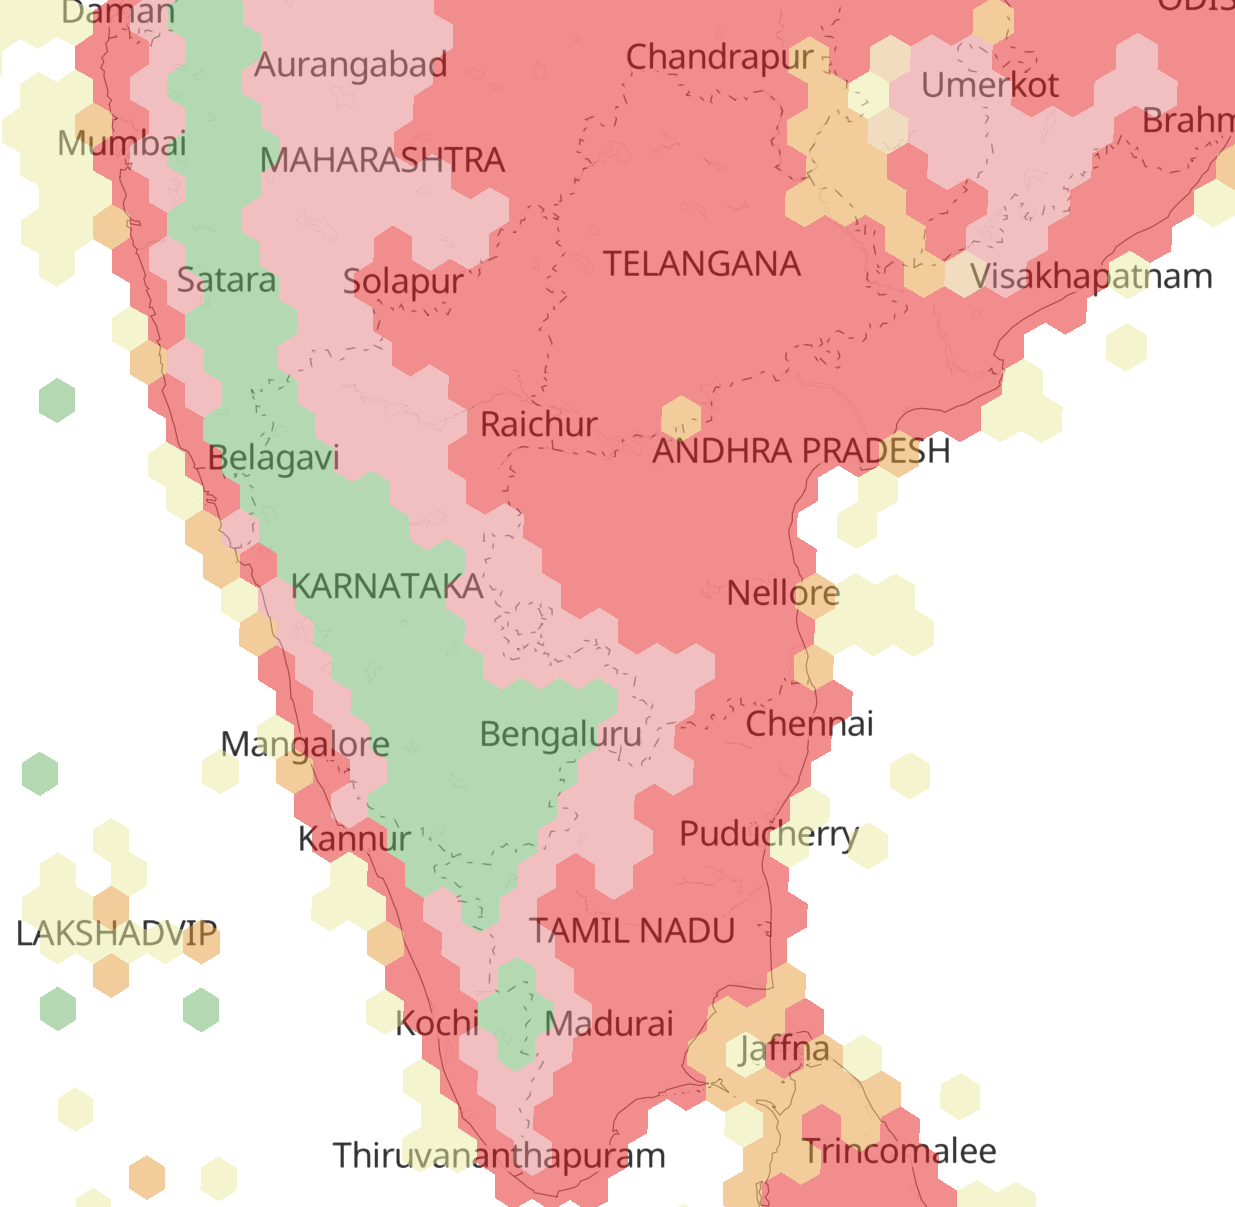
For instance, one of the most popular ways to aggregate data on the map is to use administrative boundaries. A vital advantage of this approach is that many governmental statistics on social and economic indicators are collected on the administrative boundaries level – in that case, such maps will always be in demand. But geographically, they are very rough – few real-world phenomena are equally distributed inside any kind of political district.
Most of the raw data is collected and shared corresponding to such administrative or landscape-based irregular zones, which makes it challenging to compare across areas and introduces certain biases in data analysis. That’s where regular zones – those with a similar shape and size – come to help to compare diverse data sets.
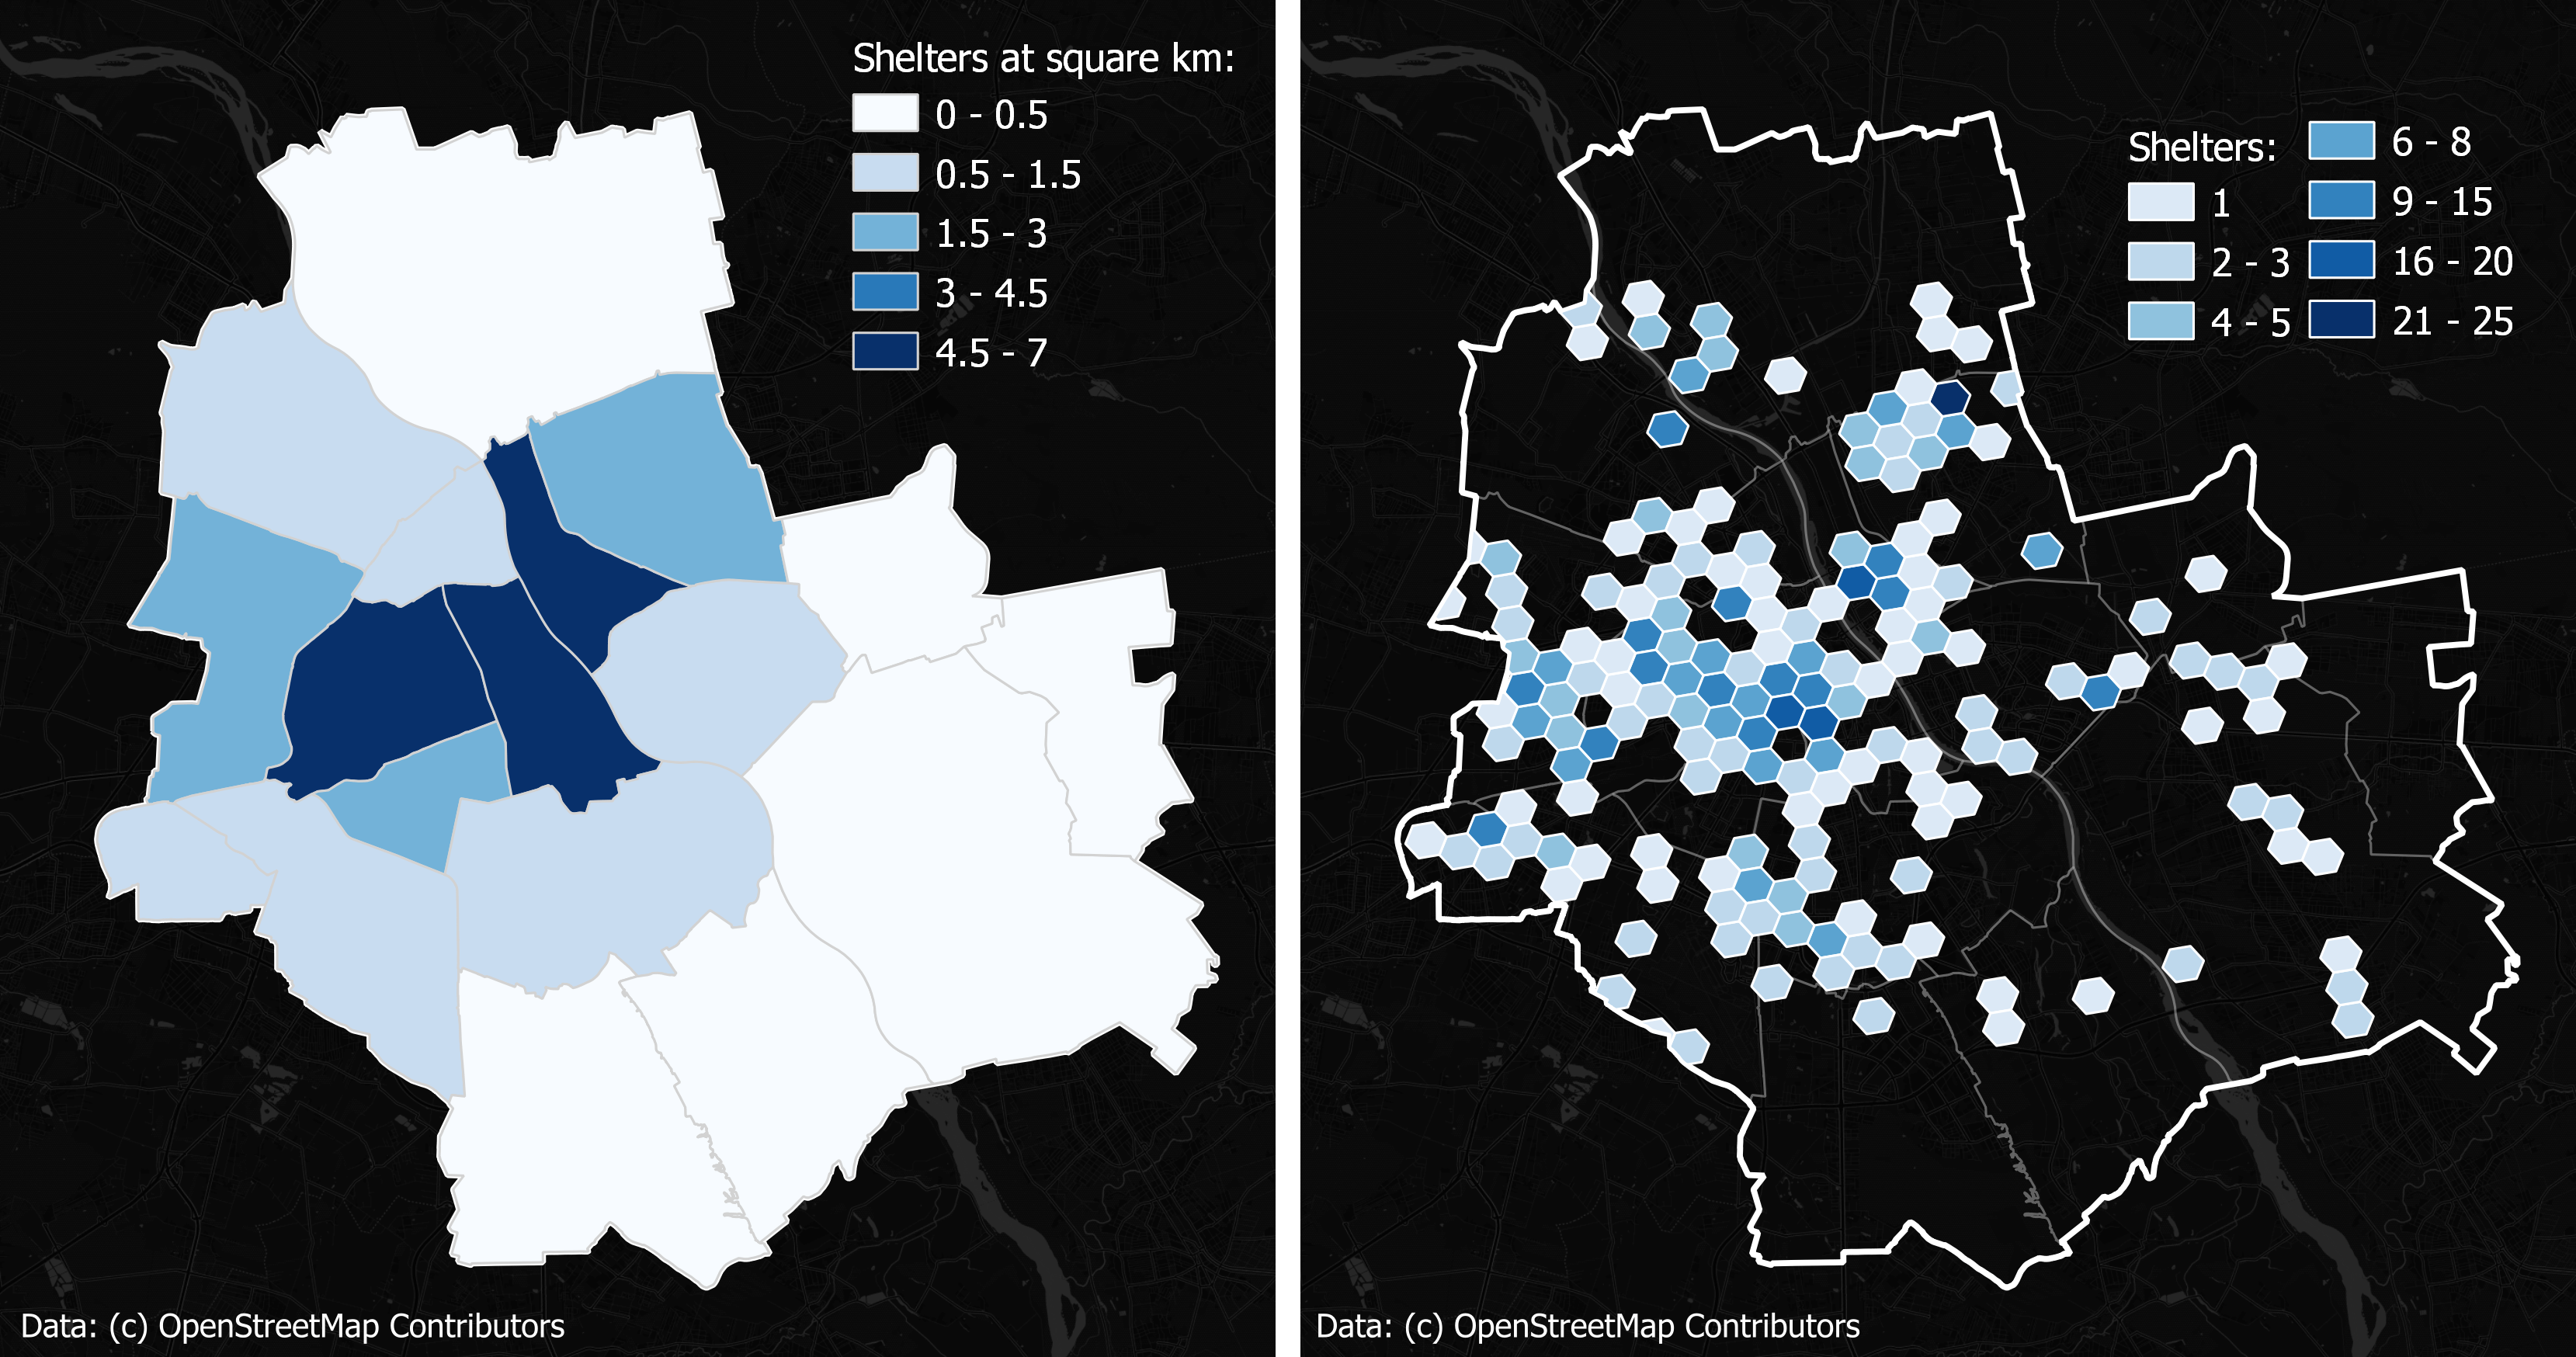
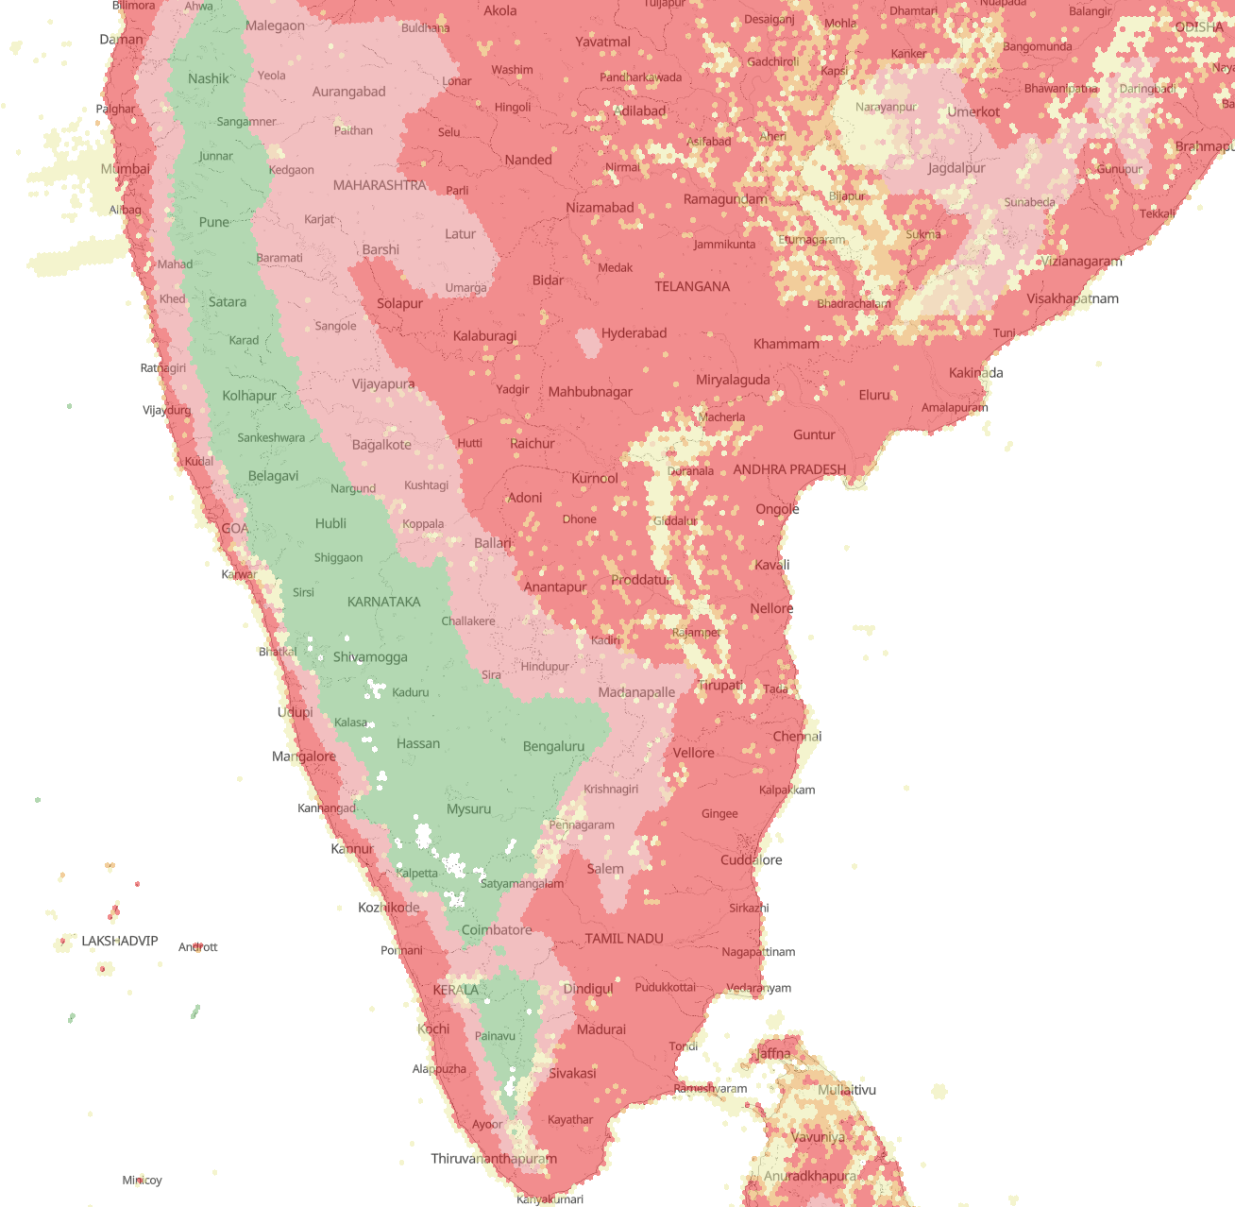
The right figure aggregates the distribution on a regular hexagonal grid. The right option is more informative and convenient
for calculations and multi-location comparisons.
A significant advantage of regular grids is that we can store very heterogeneous data, mixing up object counts, areas, lengths, and densities with social statistics, temperatures, elevations, and other natural and economic indicators. When we store everything on a regular grid, we can transparently compare grid cells and groups of them in different locations around the globe, as long as we can easily calculate multi-indicator derivatives inside any cells. For example, we can ask a question – how does the relationship between population density and road length differ in Delhi and Prague? – and get a rapid and precise answer.
As one of the three types of regular zones with tessellation (triangles and squares are the other two), hexagons have the following advantages:
- As already mentioned, a hexagon’s centroid has an equal distance to any adjacent hexagon’s centroid in any direction, which makes it easier and more efficient to calculate distances to the neighbor regions. A hexagon’s identical spatial relationship with its surrounding cells simplifies spatial query processing.
- A hexagon has a low perimeter-to-area ratio, or the most “circular” polygonal shape that can tessellate (a circle itself can’t), which reduces sampling bias created by edge effects. There are fewer outliers than in squares or triangles of the same size.
- A hexagon’s geometry makes representing curves of real-life objects such as roads and rivers easier.
- In a large area, the earth’s curvature causes less distortion to a hexagonal grid than to a square grid.
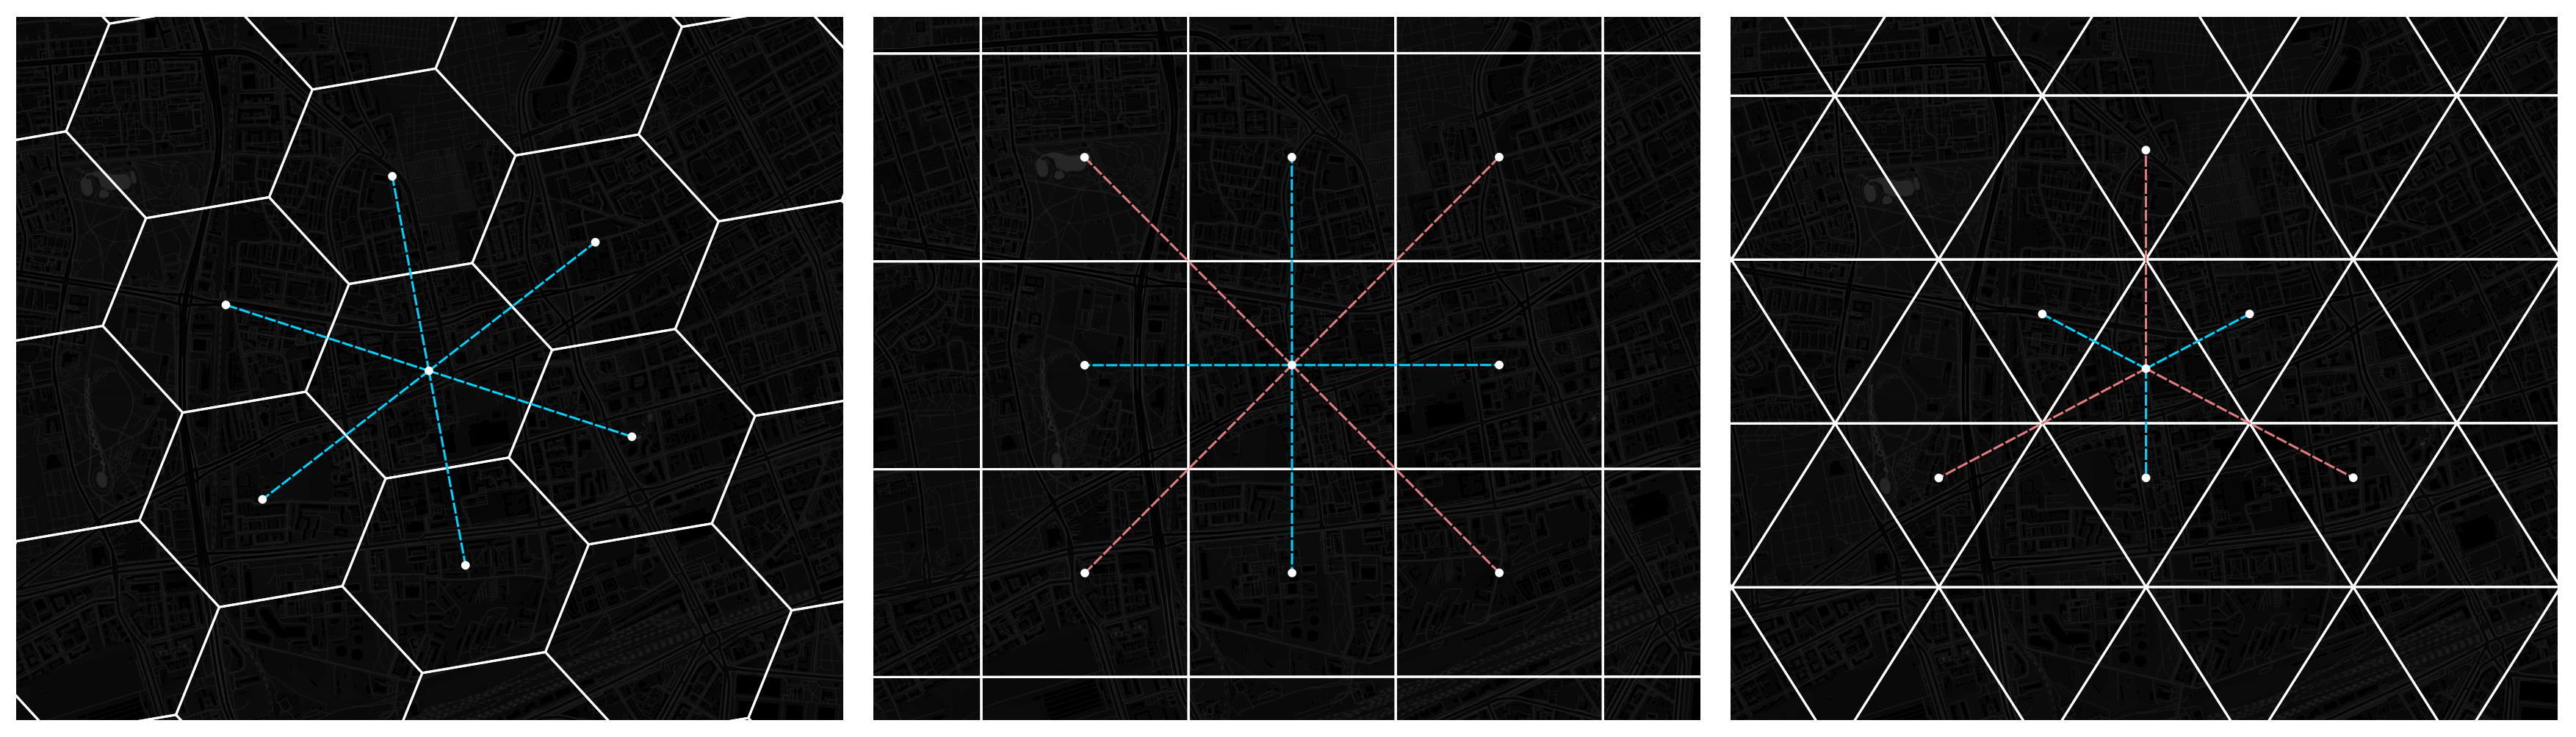
Only the hexagonal grid provides an equal distance between the centers of neighboring cells.
There are at least two different distance categories for other kinds of grids.
Are hexagonal grids always best to use?
Despite all the advantages, a hexagonal grid is not universally optimal. Indeed, you can often encounter square grids in GIS analysis and thematic mapping. Consider what you want to achieve, your target audience, and your area of interest, as well as take into account the following points:
- Hexagons containing boundaries present particular issues. For instance, population density in a coastal area may appear lower than in reality when hexagons cover both water and ground surface. There are, however, ways to mitigate the “boundary effect,” such as displaying hexagons with higher resolution along the coast.
- The cell size is generally critical. The map’s purpose and the type of answers it intends to provide should define the hexagon resolution.
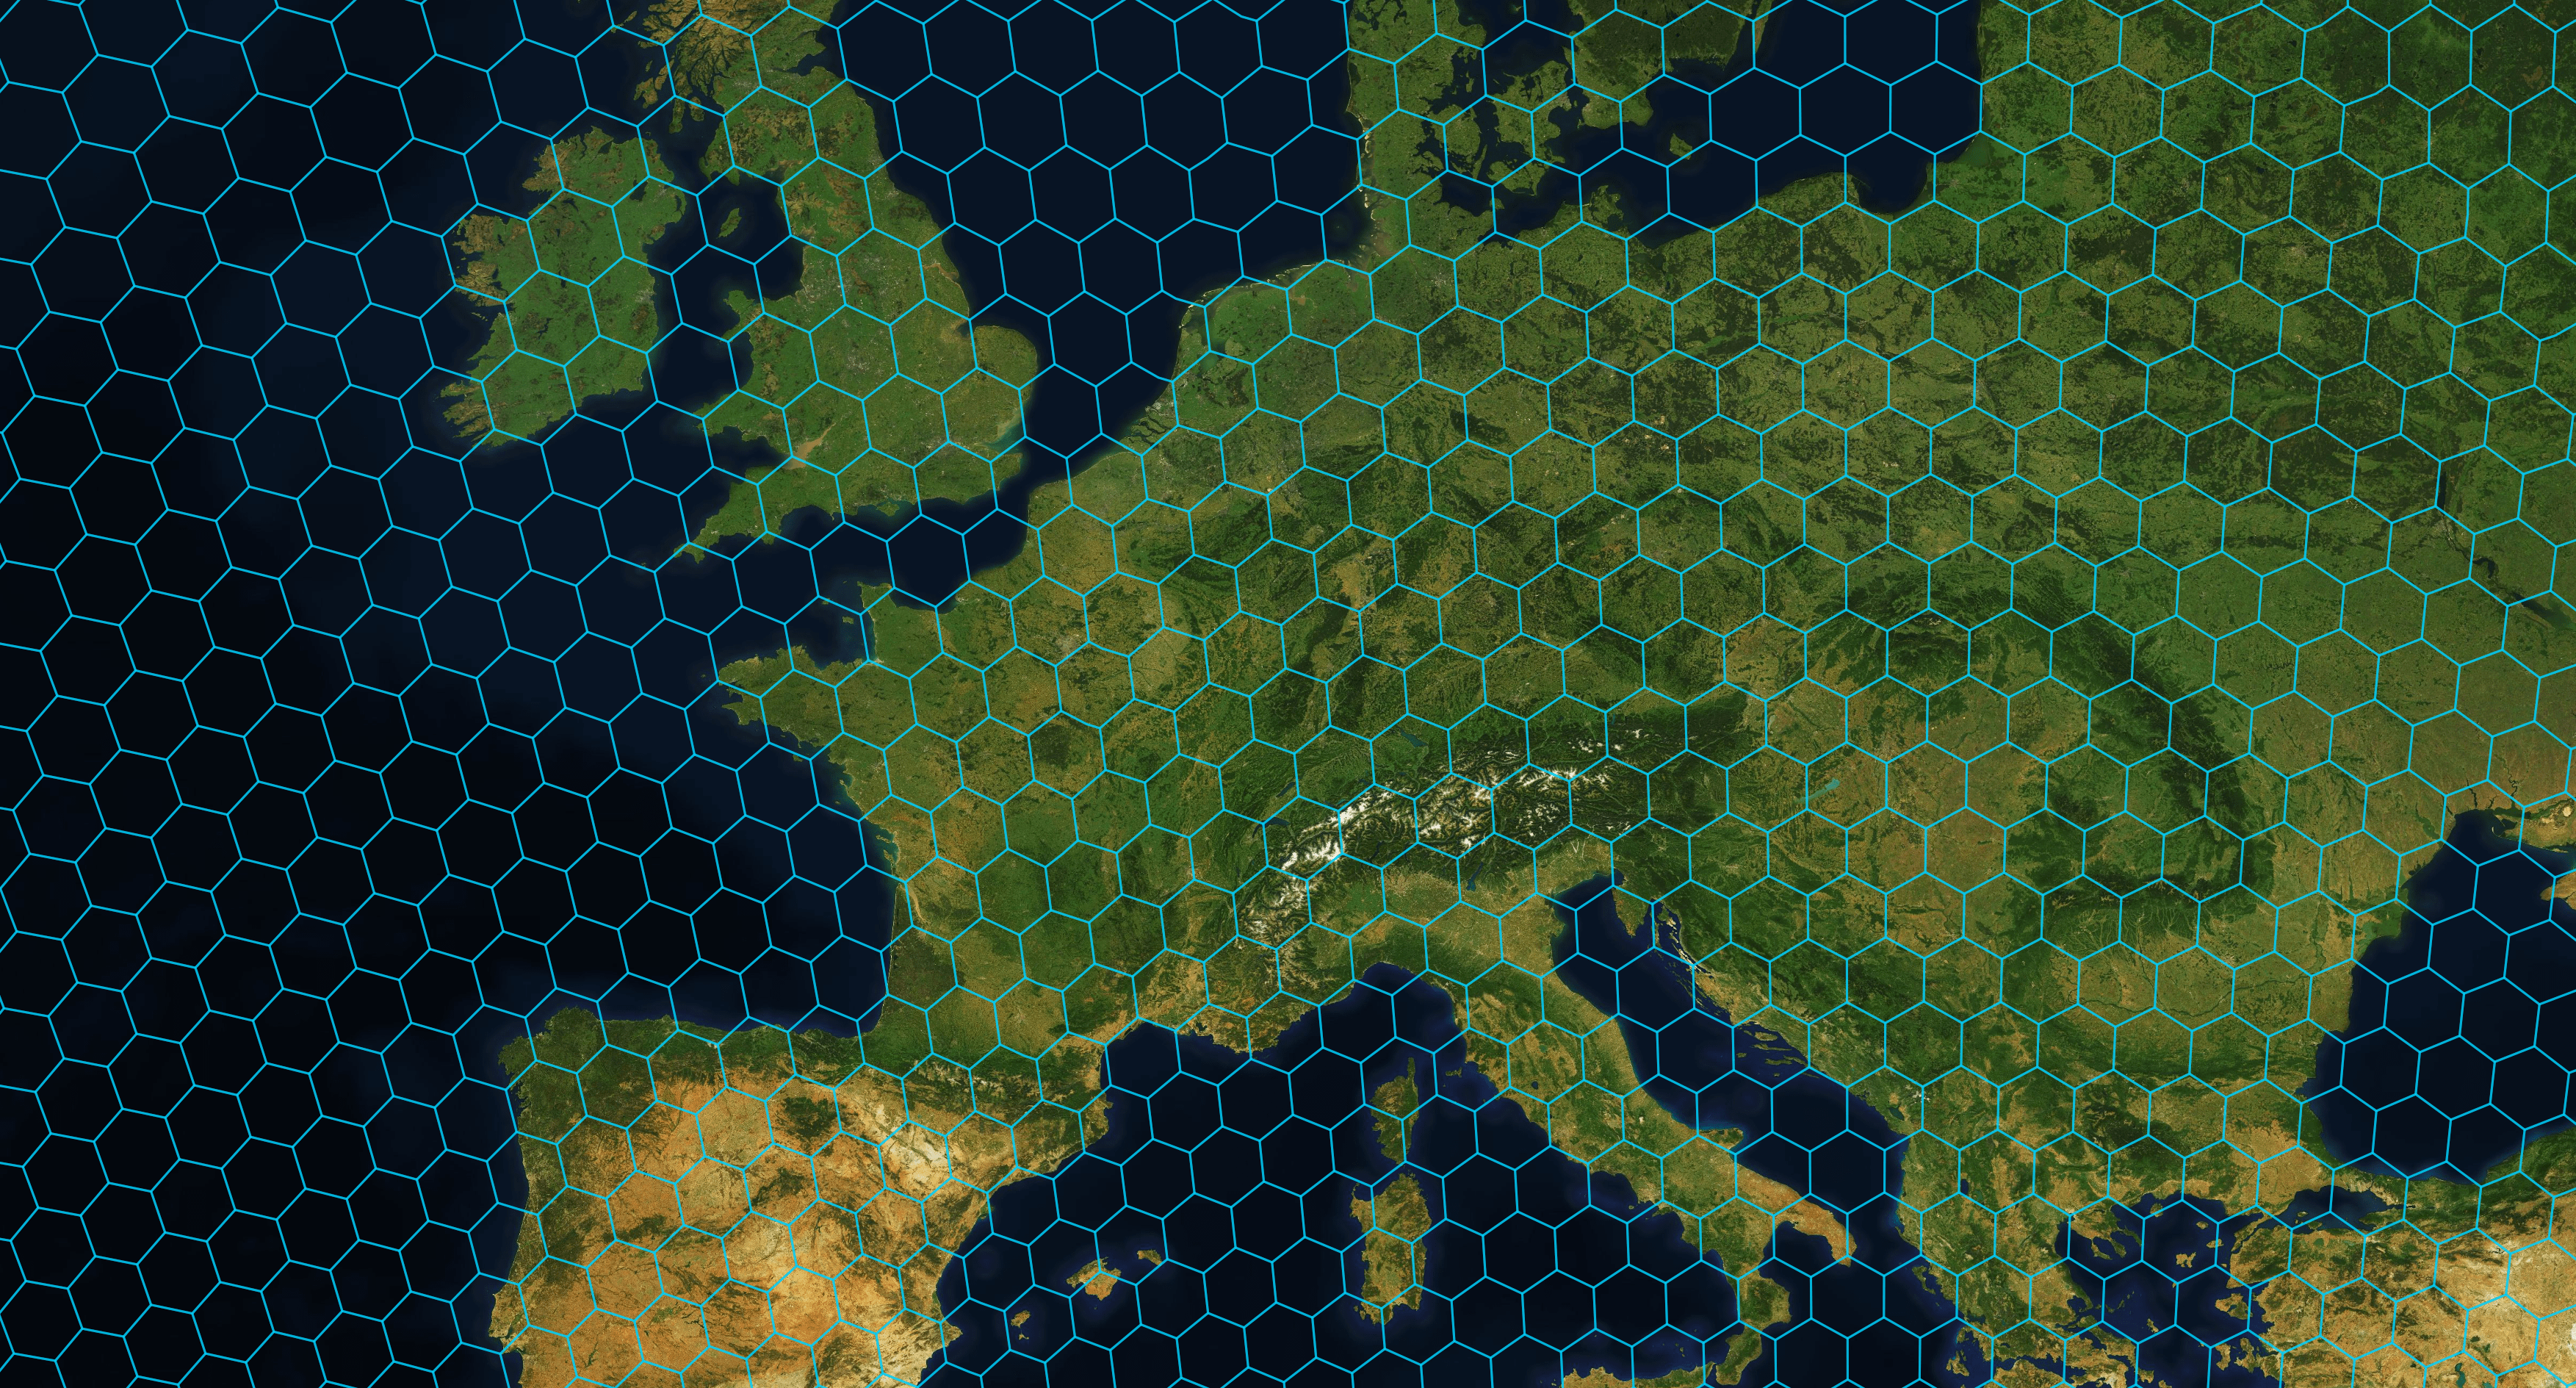
How is a hexagonal grid applied on the world map?
Several hierarchical grid systems exist for analyzing spatial datasets. H3, a 16-level hexagonal global grid, maps the spherical earth and assigns indexes to all cells based on the spatial hierarchy. It benefits from the advantages of using hexagons as outlined above and shouldn’t be confused with ST_HexagonGrid in PostGIS, which tiles a plane surface. H3 grids are also well-suited for storing raster data and machine learning. These advantages have made the H3 system Kontur’s preferred choice for data aggregation and analysis.
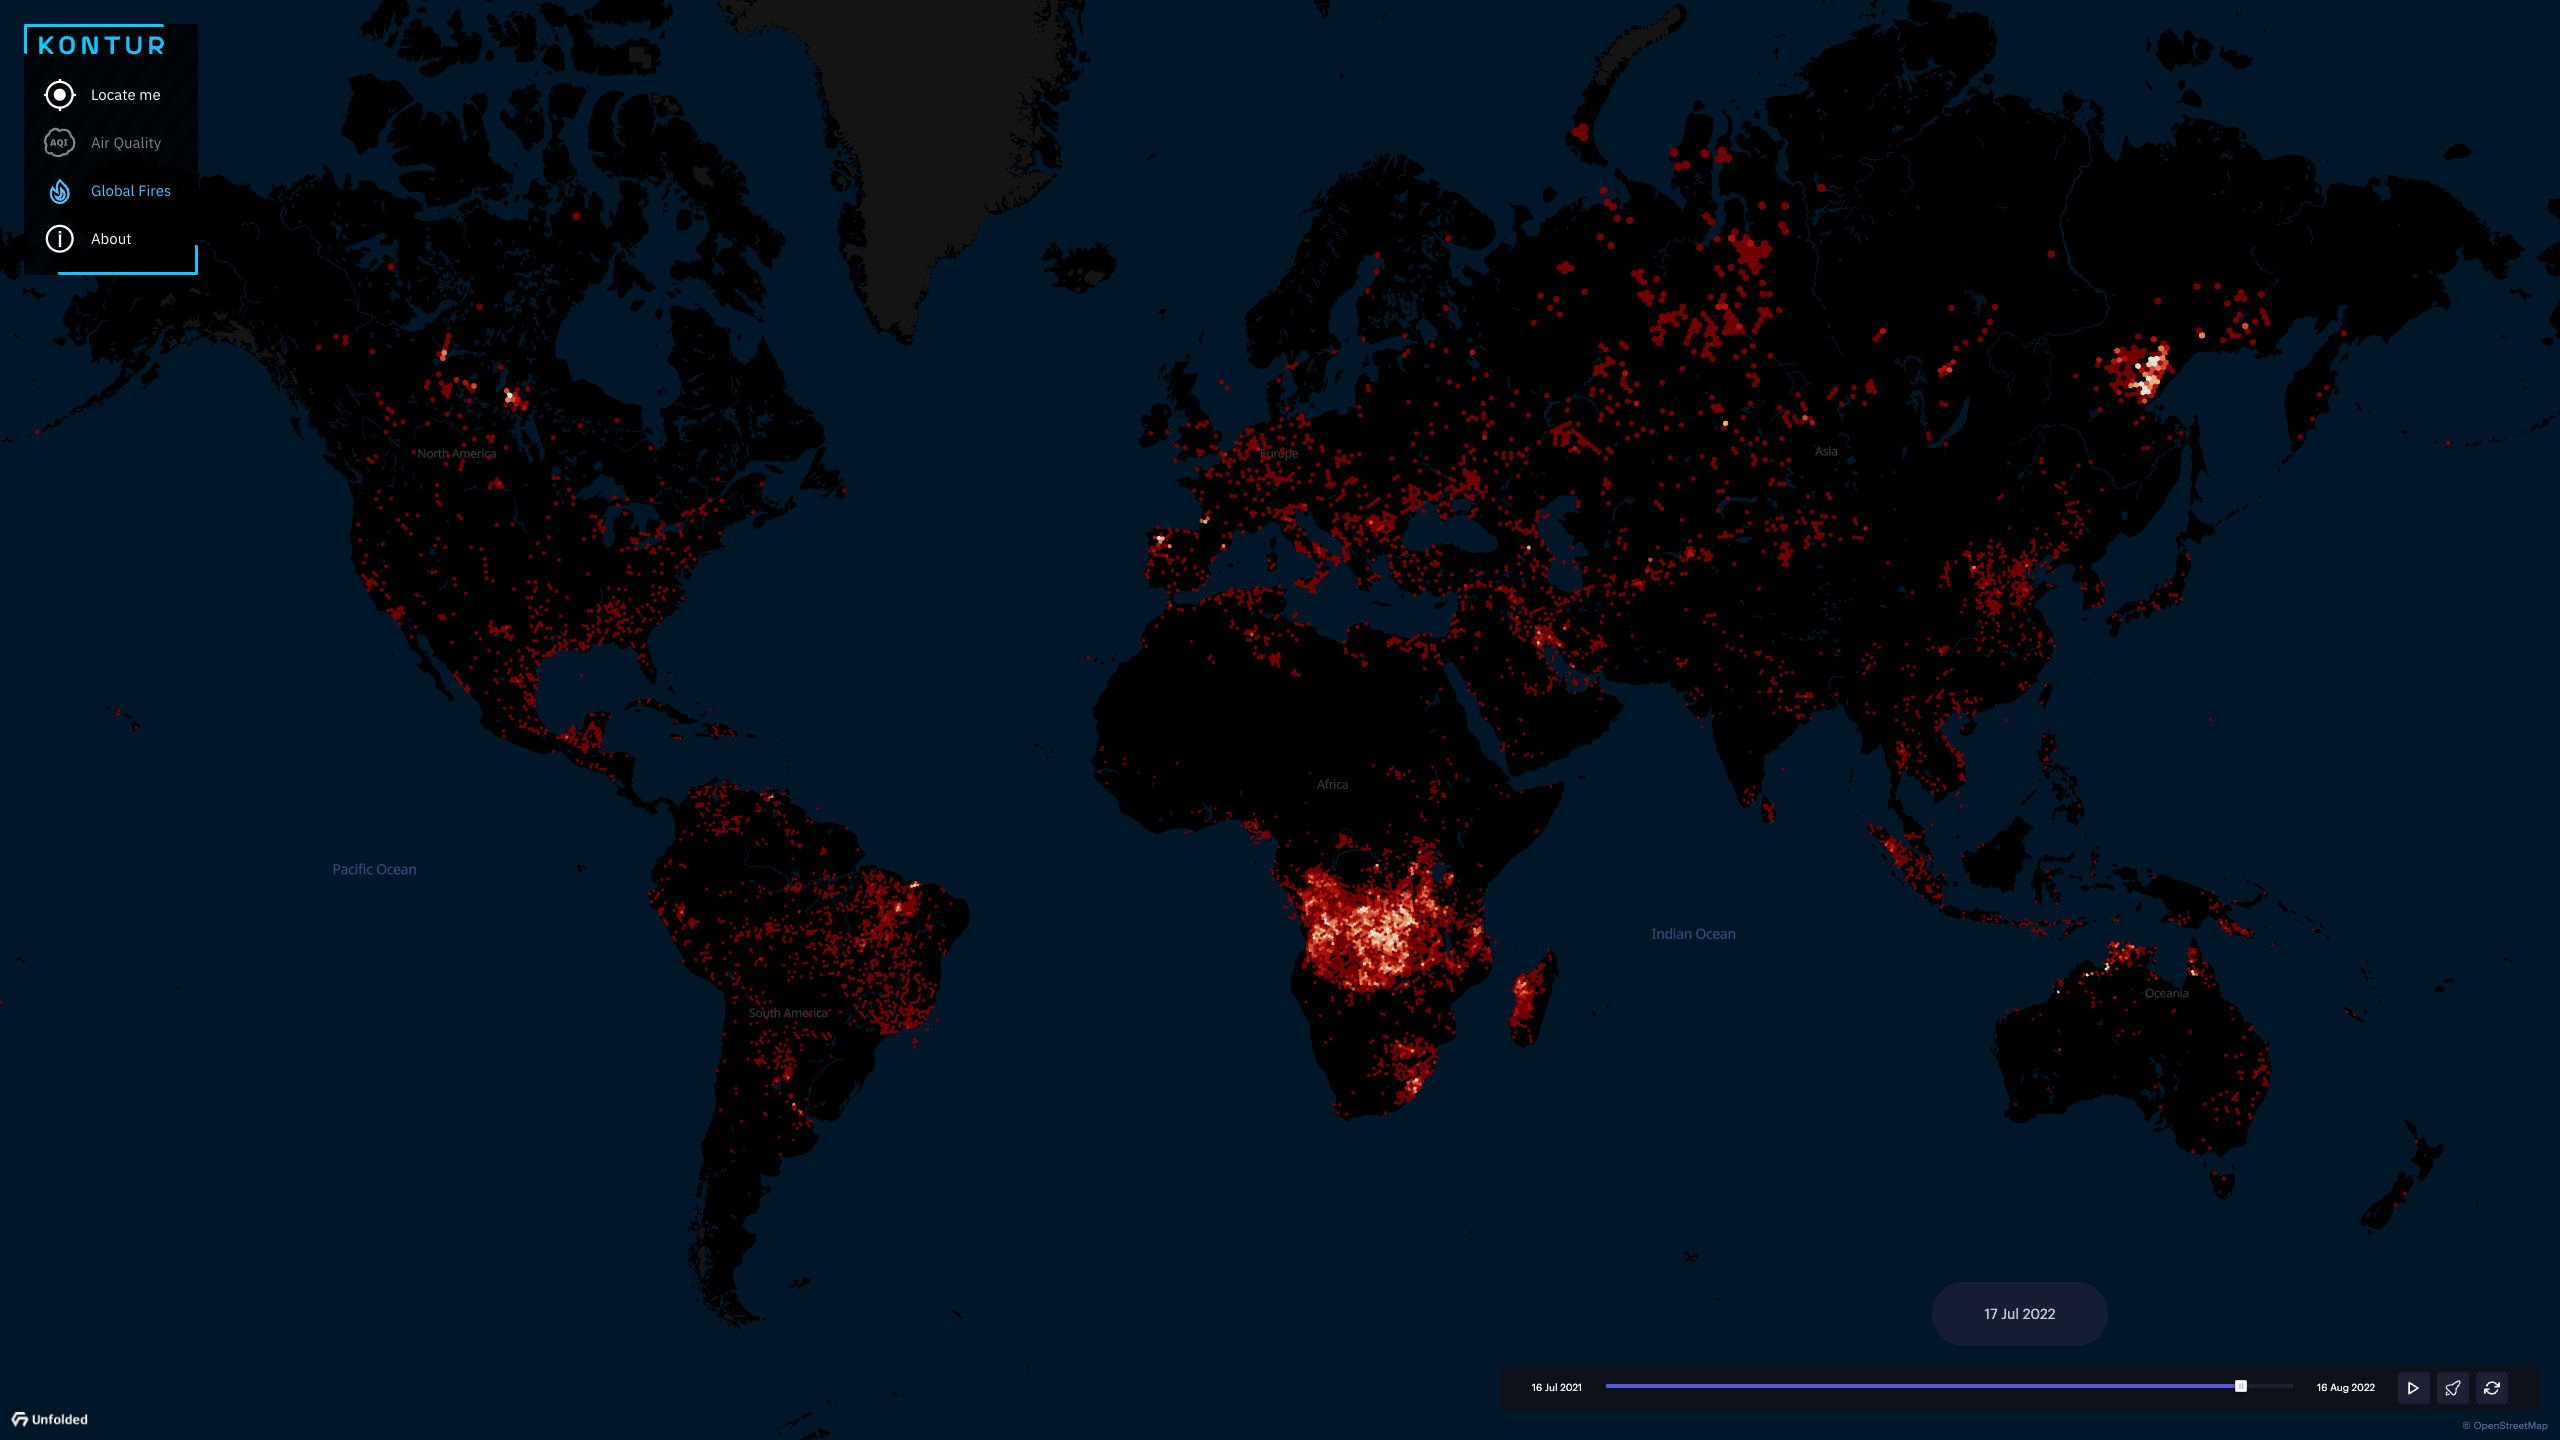
The open-source H3 Library is a product of a team of geospatial experts who founded Unfolded, a startup company now part of Foursquare. Unfolded has recognized our work by including Kontur Population as one of the primary datasets in their Data Catalog. We have also partnered to create the Global Fires viewer, where fires worldwide are aggregated for the latest 13 months with the help of H3 hexagons.
How do you create and read maps with hexagons?
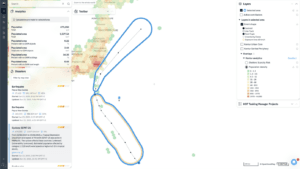
To avoid technical details, it suffices to mention that aggregating data into hexagons involves overlaying the data on a layer of hexagons and requires the data to be more detailed than the intended scale of hexagons. Kontur is doing aggregation at different levels, thereby producing multi-scale hexagons that give a dynamic experience to the users of Disaster Ninja, who can zoom in and zoom out to explore their region of interest.
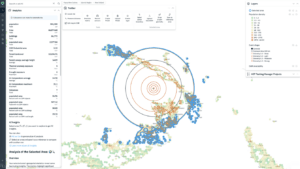
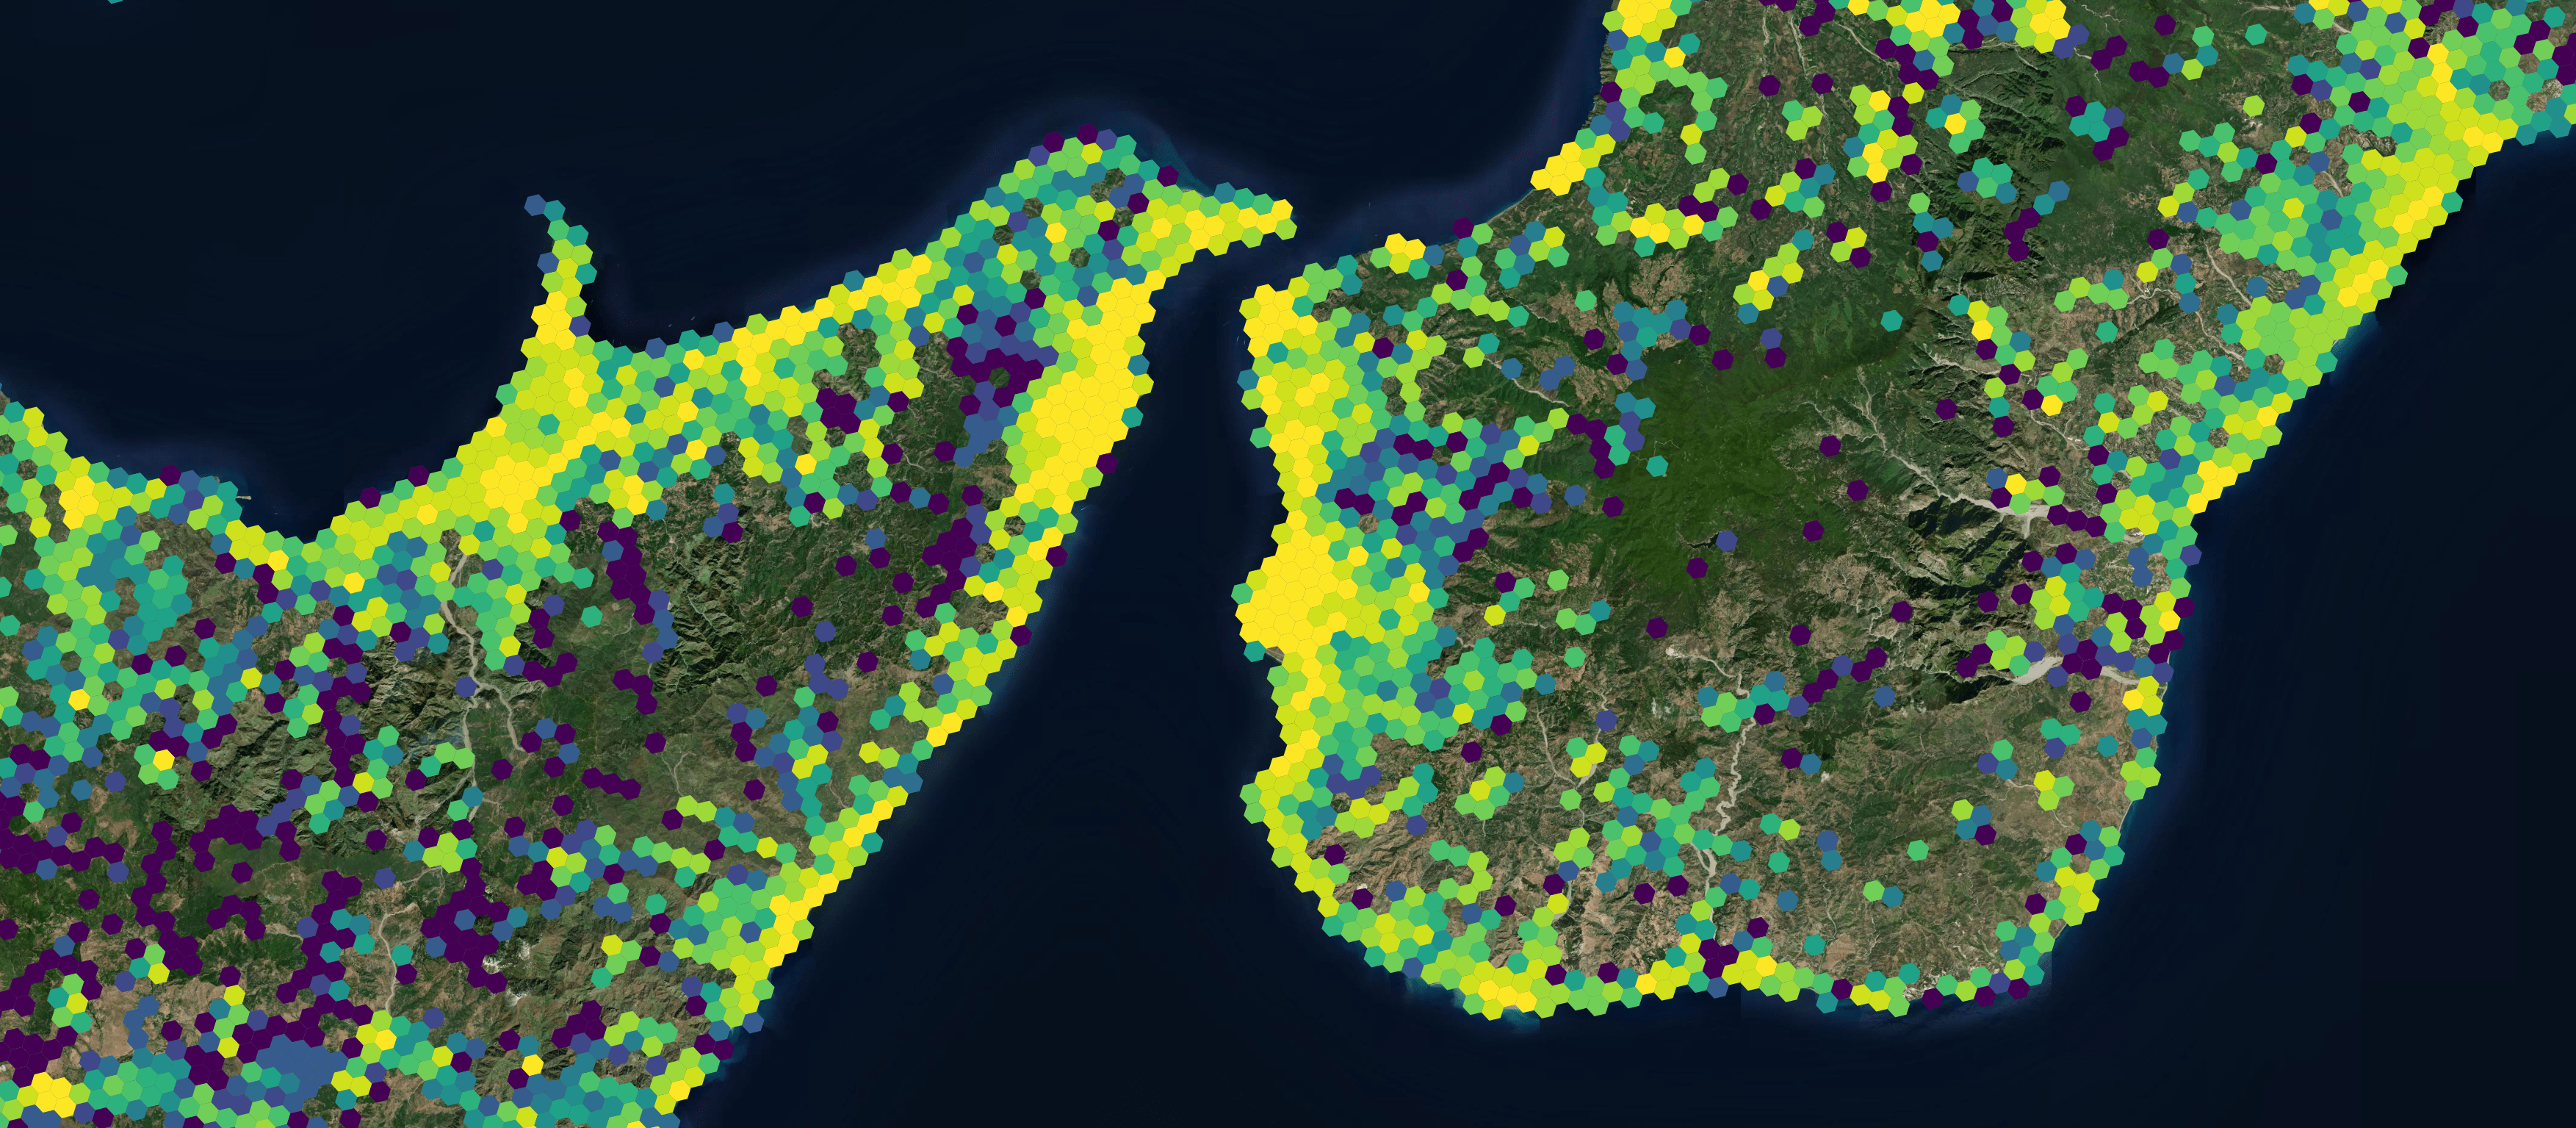
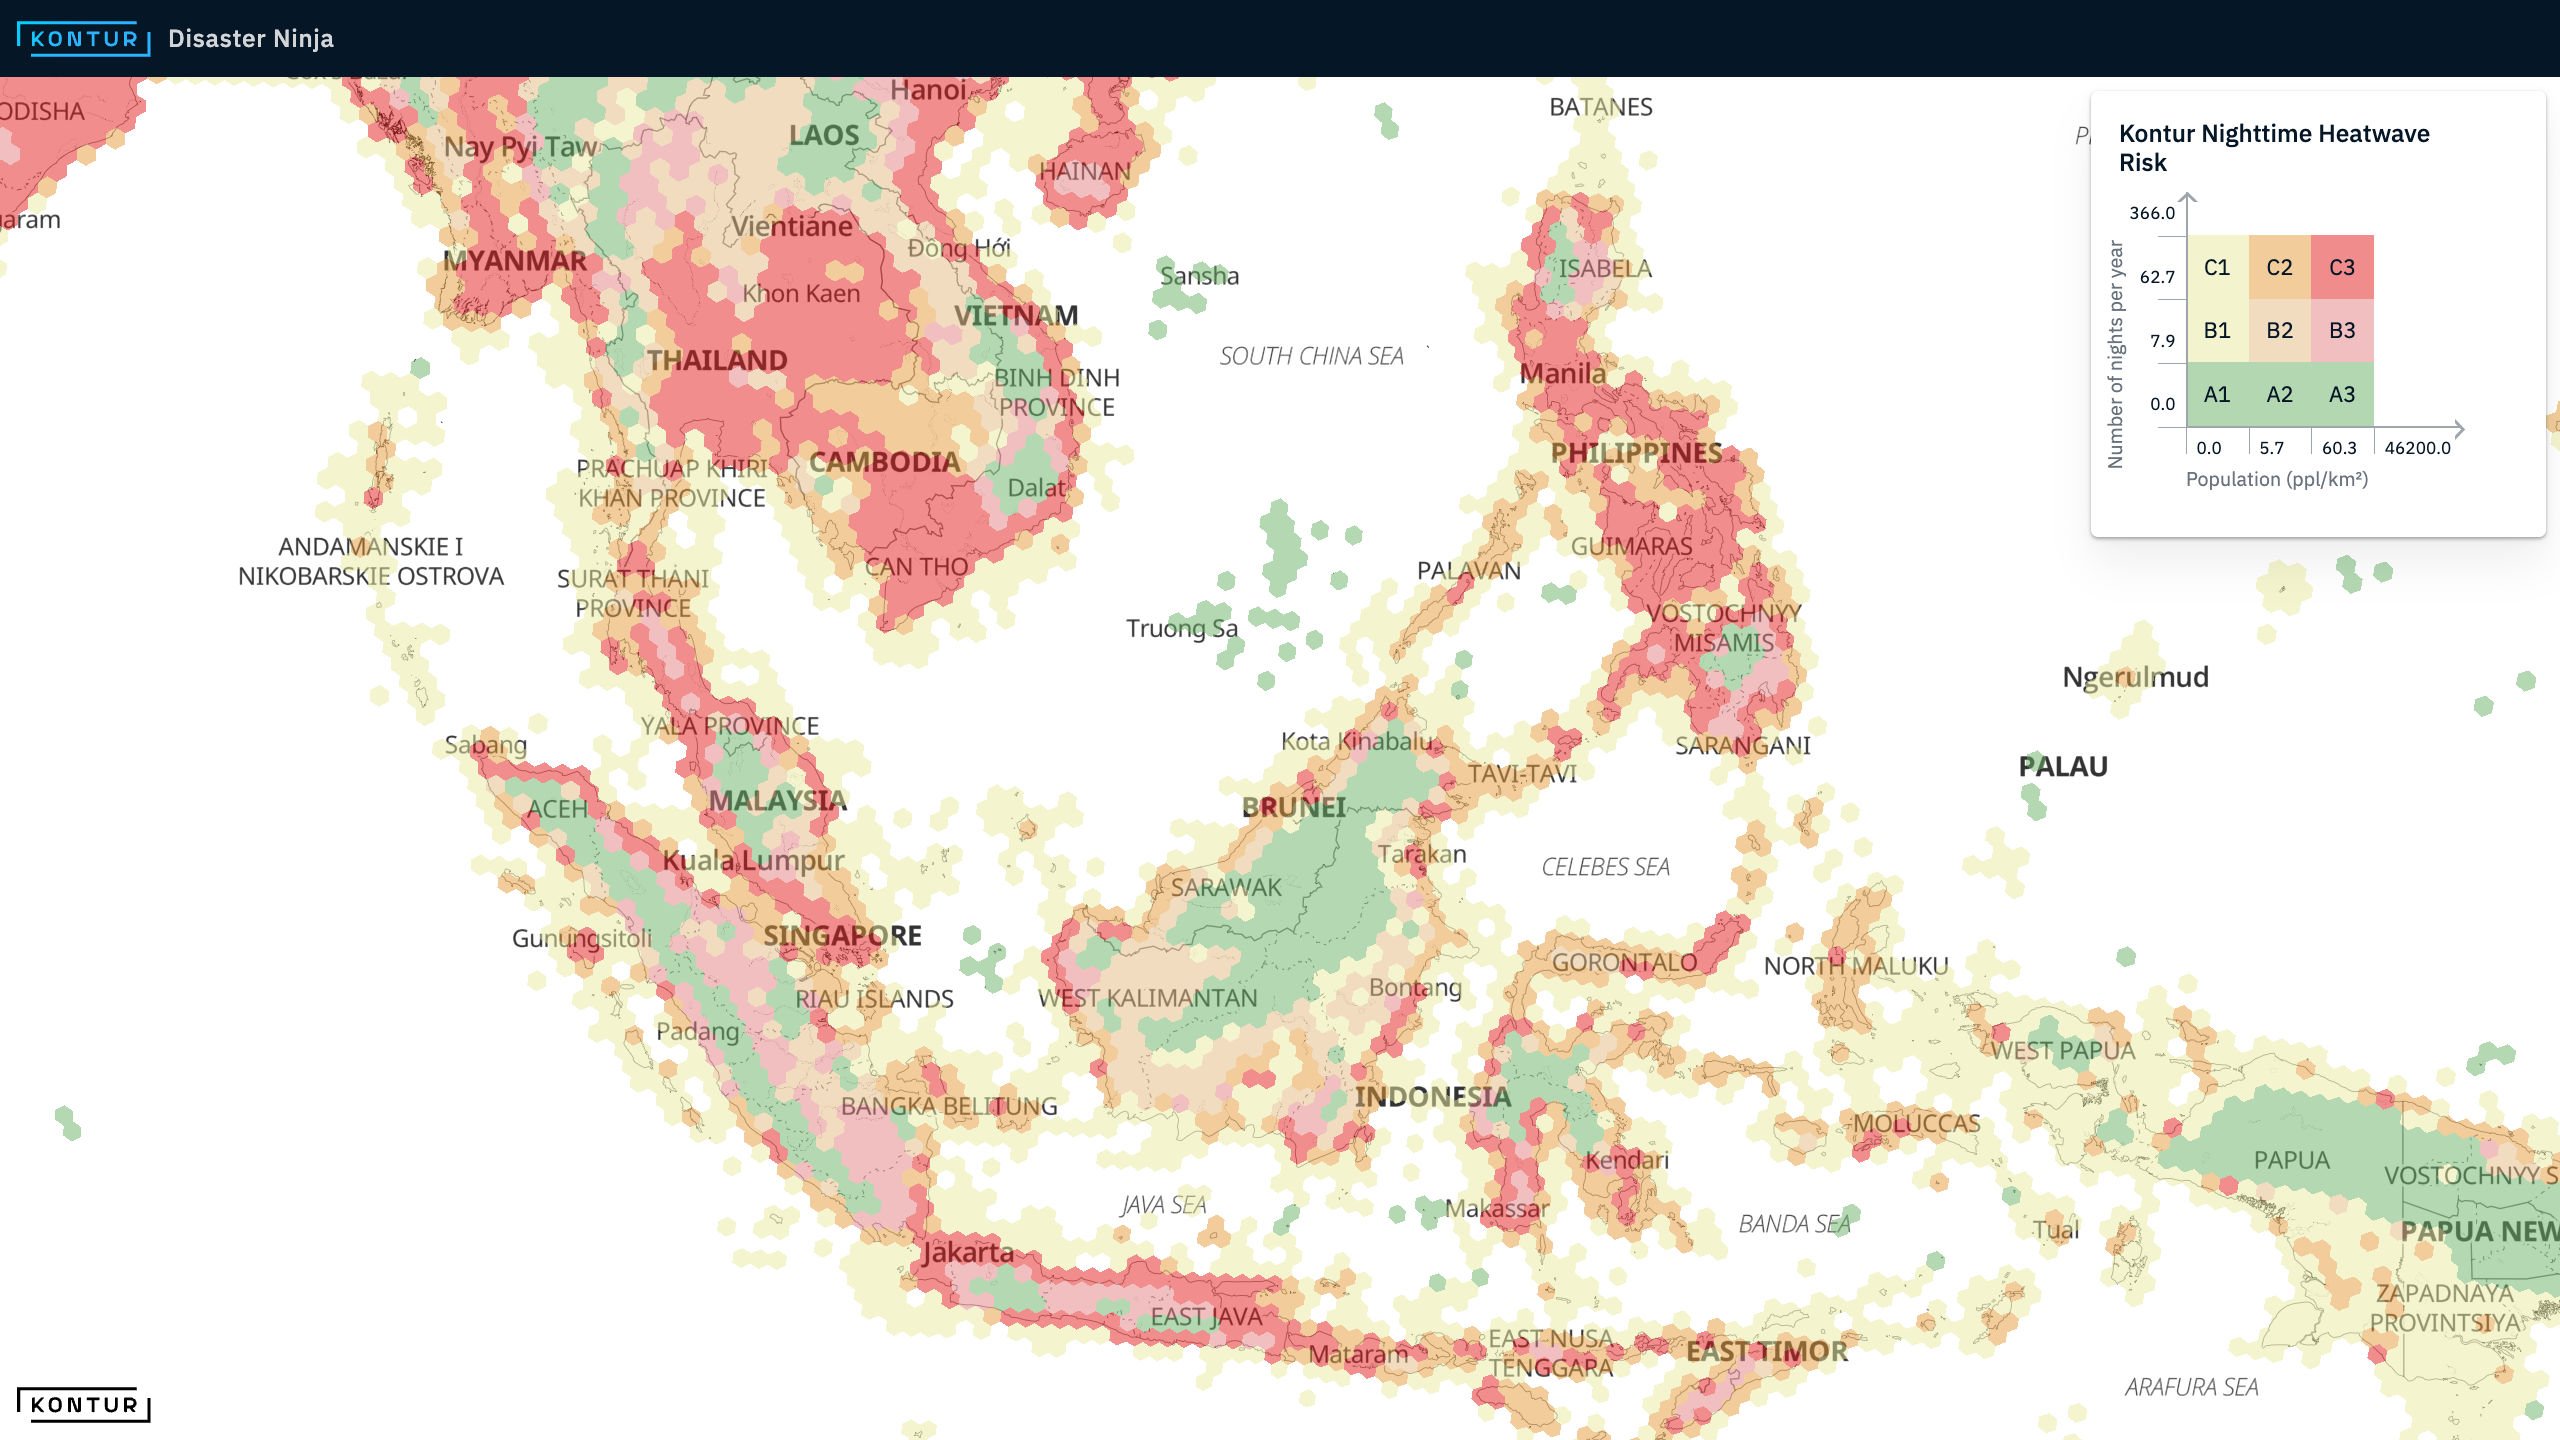
The color coding of hexagonal cells on Kontur’s maps depends on which analytical layers or combinations are selected. The intuitive color choice makes it easier for the users to understand patterns in the data. For example, you can find densely populated areas exposed to nighttime heat waves represented by red hexagons on the map below.
Zooming allows you to change the resolution of hexagons and explore data at a more granular level.
At Kontur, we work with PostgreSQL and use h3-pg, the respective bindings for H3, actively maintaining the bindings library. For a more detailed explanation of how we bring the data represented in a square grid to the H3 hexagonal grid of the proper resolution, read this earlier post in our blog.
To sum up, hexagonal grids are a powerful tool for data visualization and analysis due to the geometric advantages of the hexagon shape. With the help of the H3 indexing system, one can partition the entire earth’s surface into hexagonal cells at various resolutions. To explore an H3-based map in practice and gain further insight, go to Disaster Ninja or contact us at hello@kontur.io.