Kontur team has years of experience in creating basemaps for various domains and purposes: disaster management, logistics, games, agriculture, business intelligence, and many others. Regardless of the purpose, a basemap is a fundamental map layer containing geographic information to provide location references for any data layers visualized on top of it.
Utilizing the proper basemap can make a difference between a map with confusing colored lines and tiles and a clear, insightful message you actually need for your analytics.
Vector Global Basemaps
Our meticulously designed map styles are crafted to complement your data visualizations seamlessly. With Kontur Lines or Kontur Zmrok as your foundation, you can layer choropleth maps confidently, knowing that the underlying design will support and enhance the representation of your data.
There’s no competition for attention; your data takes center stage, ensuring a clean, undistorted, and accurate depiction of the trends and patterns you wish to convey.
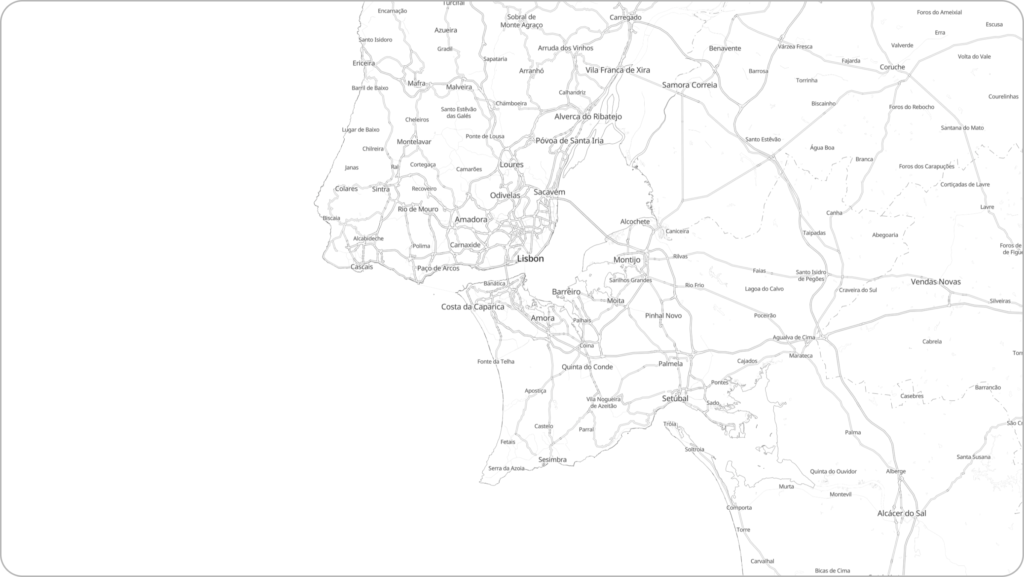
Kontur Lines
Light basemap
Crisp and unobtrusive background, perfect for overlaying detailed data. Light color scheme provides excellent readability and a contemporary feel, ideal for applications that require a clean and professional look.
This clean style is used extensively in Disaster Ninja.
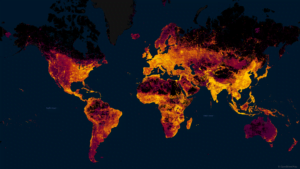
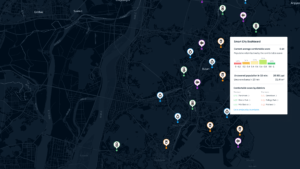
Kontur Zmrok
Dark basemap
Sleek and modern aesthetic. The dark backdrop creates a stark contrast for data points, making them stand out vividly.
It’s best suited for dynamic visualizations and applications used in low-light conditions where a darker theme can minimize strain on the eyes.
This basemap style is used in Global Fires interactive map.
Benefits of Our Map Using Vector Tiles
Disaster Management Specialization
Kontur’s experience and focus on disaster management could be a strong USP. Offering basemaps optimized for emergency response, with features tailored for disaster risk assessment, could position Kontur as the go-to provider for organizations involved in this field.
Regular OSM Data Updates
With updates every 2 days incorporating the latest OpenStreetMap data, Kontur ensures that users have access to the most current and accurate geographic information. This frequency is particularly vital for applications requiring up-to-the-minute data, providing a significant edge in decision-making processes.
Customization with MapCSS
Leveraging Kontur’s proficiency in MapCSS for deep customization could appeal to clients needing tailored visualization tools. This could be particularly enticing for sectors like urban planning, environmental monitoring, and business intelligence.
On-premise Deployment Capability
With increasing concerns about data privacy and security, offering robust on-premise deployment options can be a USP, especially for clients in sensitive or regulated industries.
Open-source Tiling System Support
For clients who prefer or require open-source solutions, Kontur’s support for this could be a differentiator, particularly if you offer excellent documentation and community support.
Language Switching Feature
In a globalized world, the ability to switch languages on-the-fly can make Kontur’s basemaps more accessible and user-friendly for international clients.
What Purpose Does This Proposal Serve?
Use Cases
In an era where data is the new currency, its effective visualization becomes paramount. Recognizing this critical intersection of data analysis and geographical representation, we’ve designed a basemap that stands as a beacon of clarity in the sea of information.
Our solution enables seamless overlaying of diverse datasets on a map, ensuring the underlying cartography remains clear and comprehensible. Here are some impactful use cases where our basemaps excel:
Urban Planning
Environmental Monitoring
Healthcare & Epidemiology
Retail & Business Expansion
Crisis Response & Management
Educational & Research Projects
Use it anywhere:
- Can be embedded as map widget into your website or application
- Can be used for your projects in Foursquare Studio and ArcGis as basemap
Do You Need a Unique Map? We Can Create a Custom One
At Kontur, we recognize the need for personalized solutions. That’s why we extend our services to custom map development, ensuring your map widget aligns perfectly with your brand, audience, and objectives. Whether it’s a specific visual theme, unique functionalities, or specialized data layers, our team is ready to turn your vision into reality.
Our proficiency in MapCSS means customization is simplified, even for those without a background in cartography.
Next Steps After Filling Out the Application
- We will contact you, discuss your individual case and terms of service. Price depends on the type of delivery, branding and customization.
- After payment, you’ll receive comprehensive instructions for integrating our basemap into your website.
- For those needing on-premise deployment, we provide extensive support for setting up our open-source tiling system on your servers, ensuring your custom map layers are always accessible and up-to-date.