Atlas login
by Andrey Sekste, Jan Dashkevich and Misha Malikin
Challenge
The port city of Batumi, Georgia’s second-largest, is a popular holiday destination known for its beautiful nature and hospitality. Yet, one problem that jeopardizes the city’s attractiveness for tourists and the overall quality of life is litter that pollutes its streets, parks, rivers, and beaches.
The types of waste particularly harmful to the environment are plastic bottles, bags, and goods containing synthetic fibers, such as wet wipes and disposable masks. While there are some recycling bins for municipal services to collect, sort, and package plastics, their number could be higher.
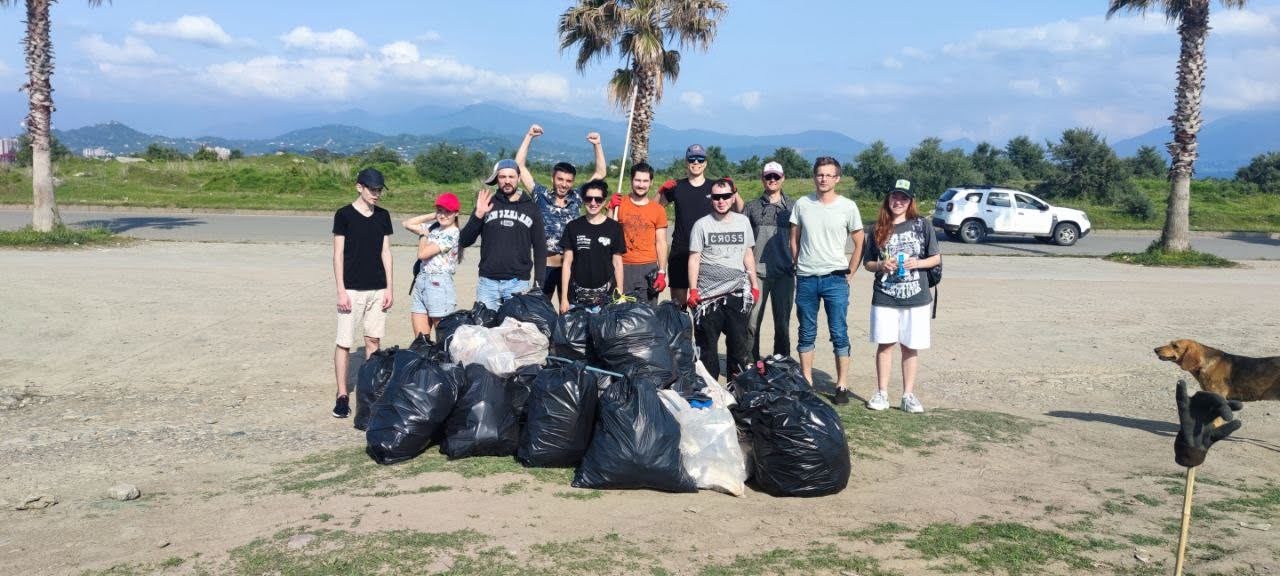
A group of volunteers, comprising local Georgians and immigrants from Ukraine, Belarus, and Russia, have decided to address the problem. They initiated “Clean Thursday,” a weekly cleanup event to remove litter from the streets. It didn’t take long before they realized they were fighting the consequences rather than the root cause of the problem: people litter where there are no waste bins.
Previous efforts
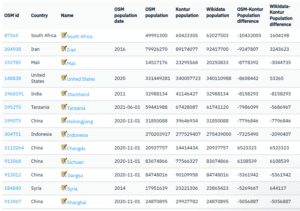
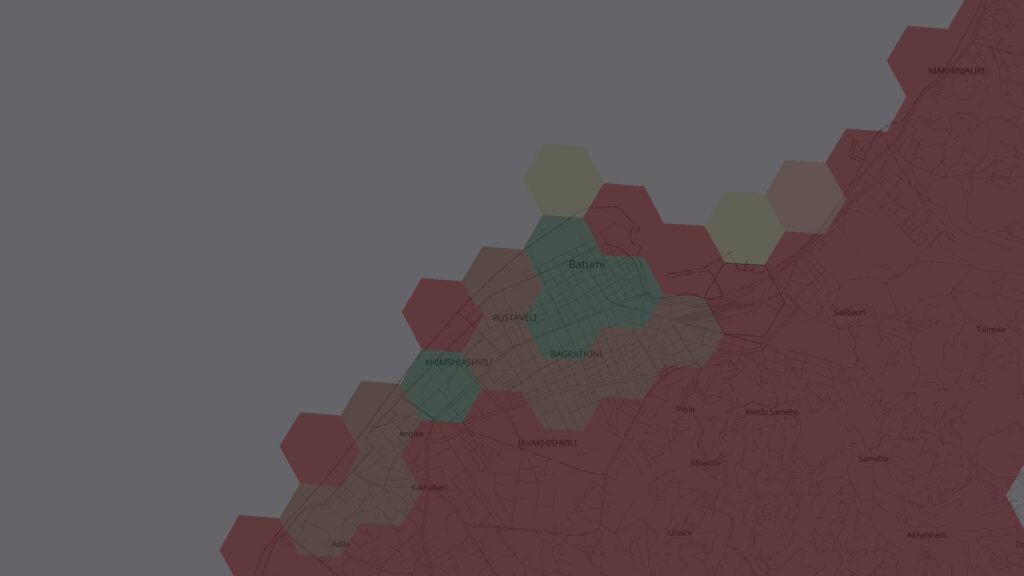
An idea emerged a few months ago to create a map of all waste bins in Batumi and use it to understand where more bins are needed to help solve the issue. Volunteers have added waste baskets and containers to OpenStreetMap through the Every Door app. They analyzed the data covering about 30% of the city and produced a heat map that displays the varying density of waste bins in different colors.
The volunteer group’s ambition is to present an interactive map to the municipal authorities with recommendations, including quantity, location, and type of additional waste bins to help clean up the city. Their ultimate goals include reducing the amount of litter, helping street sweepers in their work, engaging residents and businesses, and potentially scaling the project to the entire country.
What Kontur did
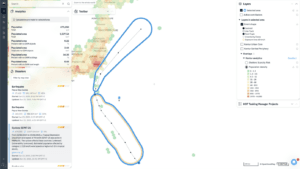
With our roots in humanitarian mapping and open-source approach, supporting social causes is at the core of Kontur’s identity. And since some of our employees live in Georgia, including in Batumi, we wanted to apply our geospatial expertise to solving local environmental challenges. We explored the city’s waste problem and started to map it in our Disaster Ninja interface.
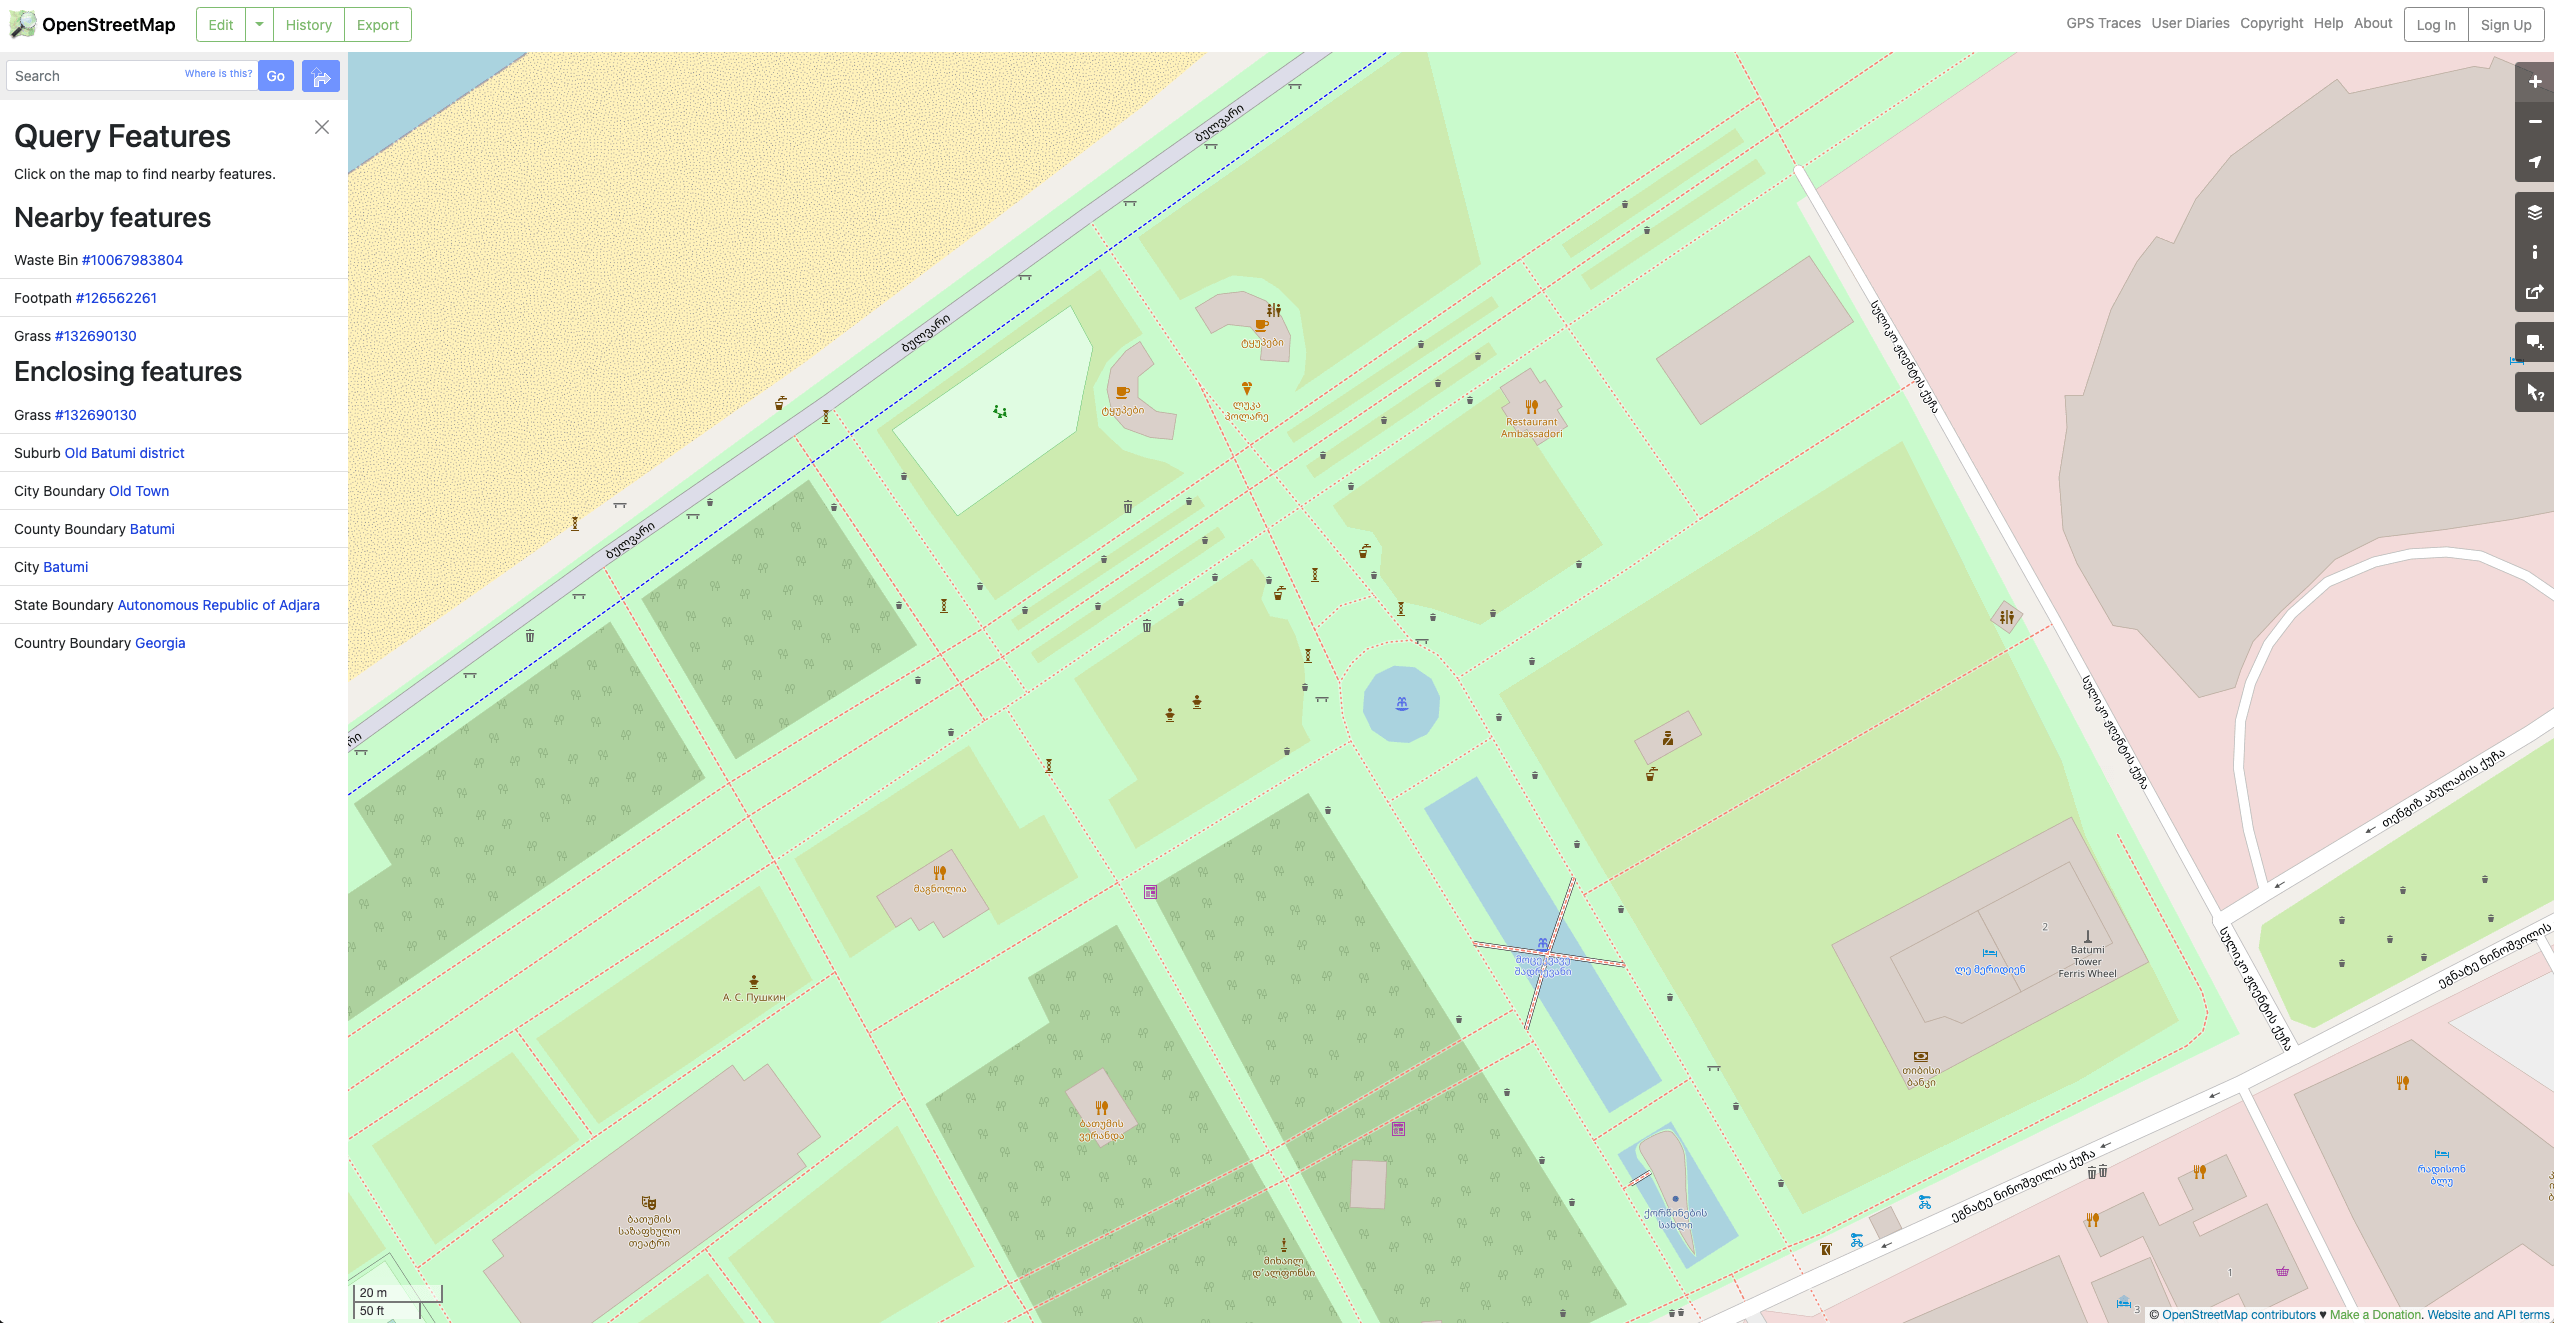
While there is little data on the optimal placement of waste bins in urban areas, some studies recommend a 75m proximity distance around containers, close to the edge length in H3 hexagons of the resolution level 10. At the same time, the Kontur Population dataset already offers population counts in H3 hexagons of the resolution level 8 globally.
For each hexagon, we divide the sum of areas of its lower-level hexagons that contain at least one waste bin (according to OpenStreetMap) by the sum of areas of lower-level hexagons that contain at least one person (according to Kontur Population). What we got is a measure of waste bin availability in the range of 0 to 100%:
Waste bin availability ratio = area covered with waste bins/populated area
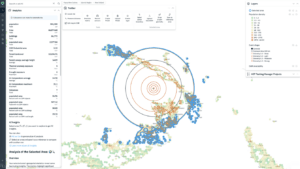
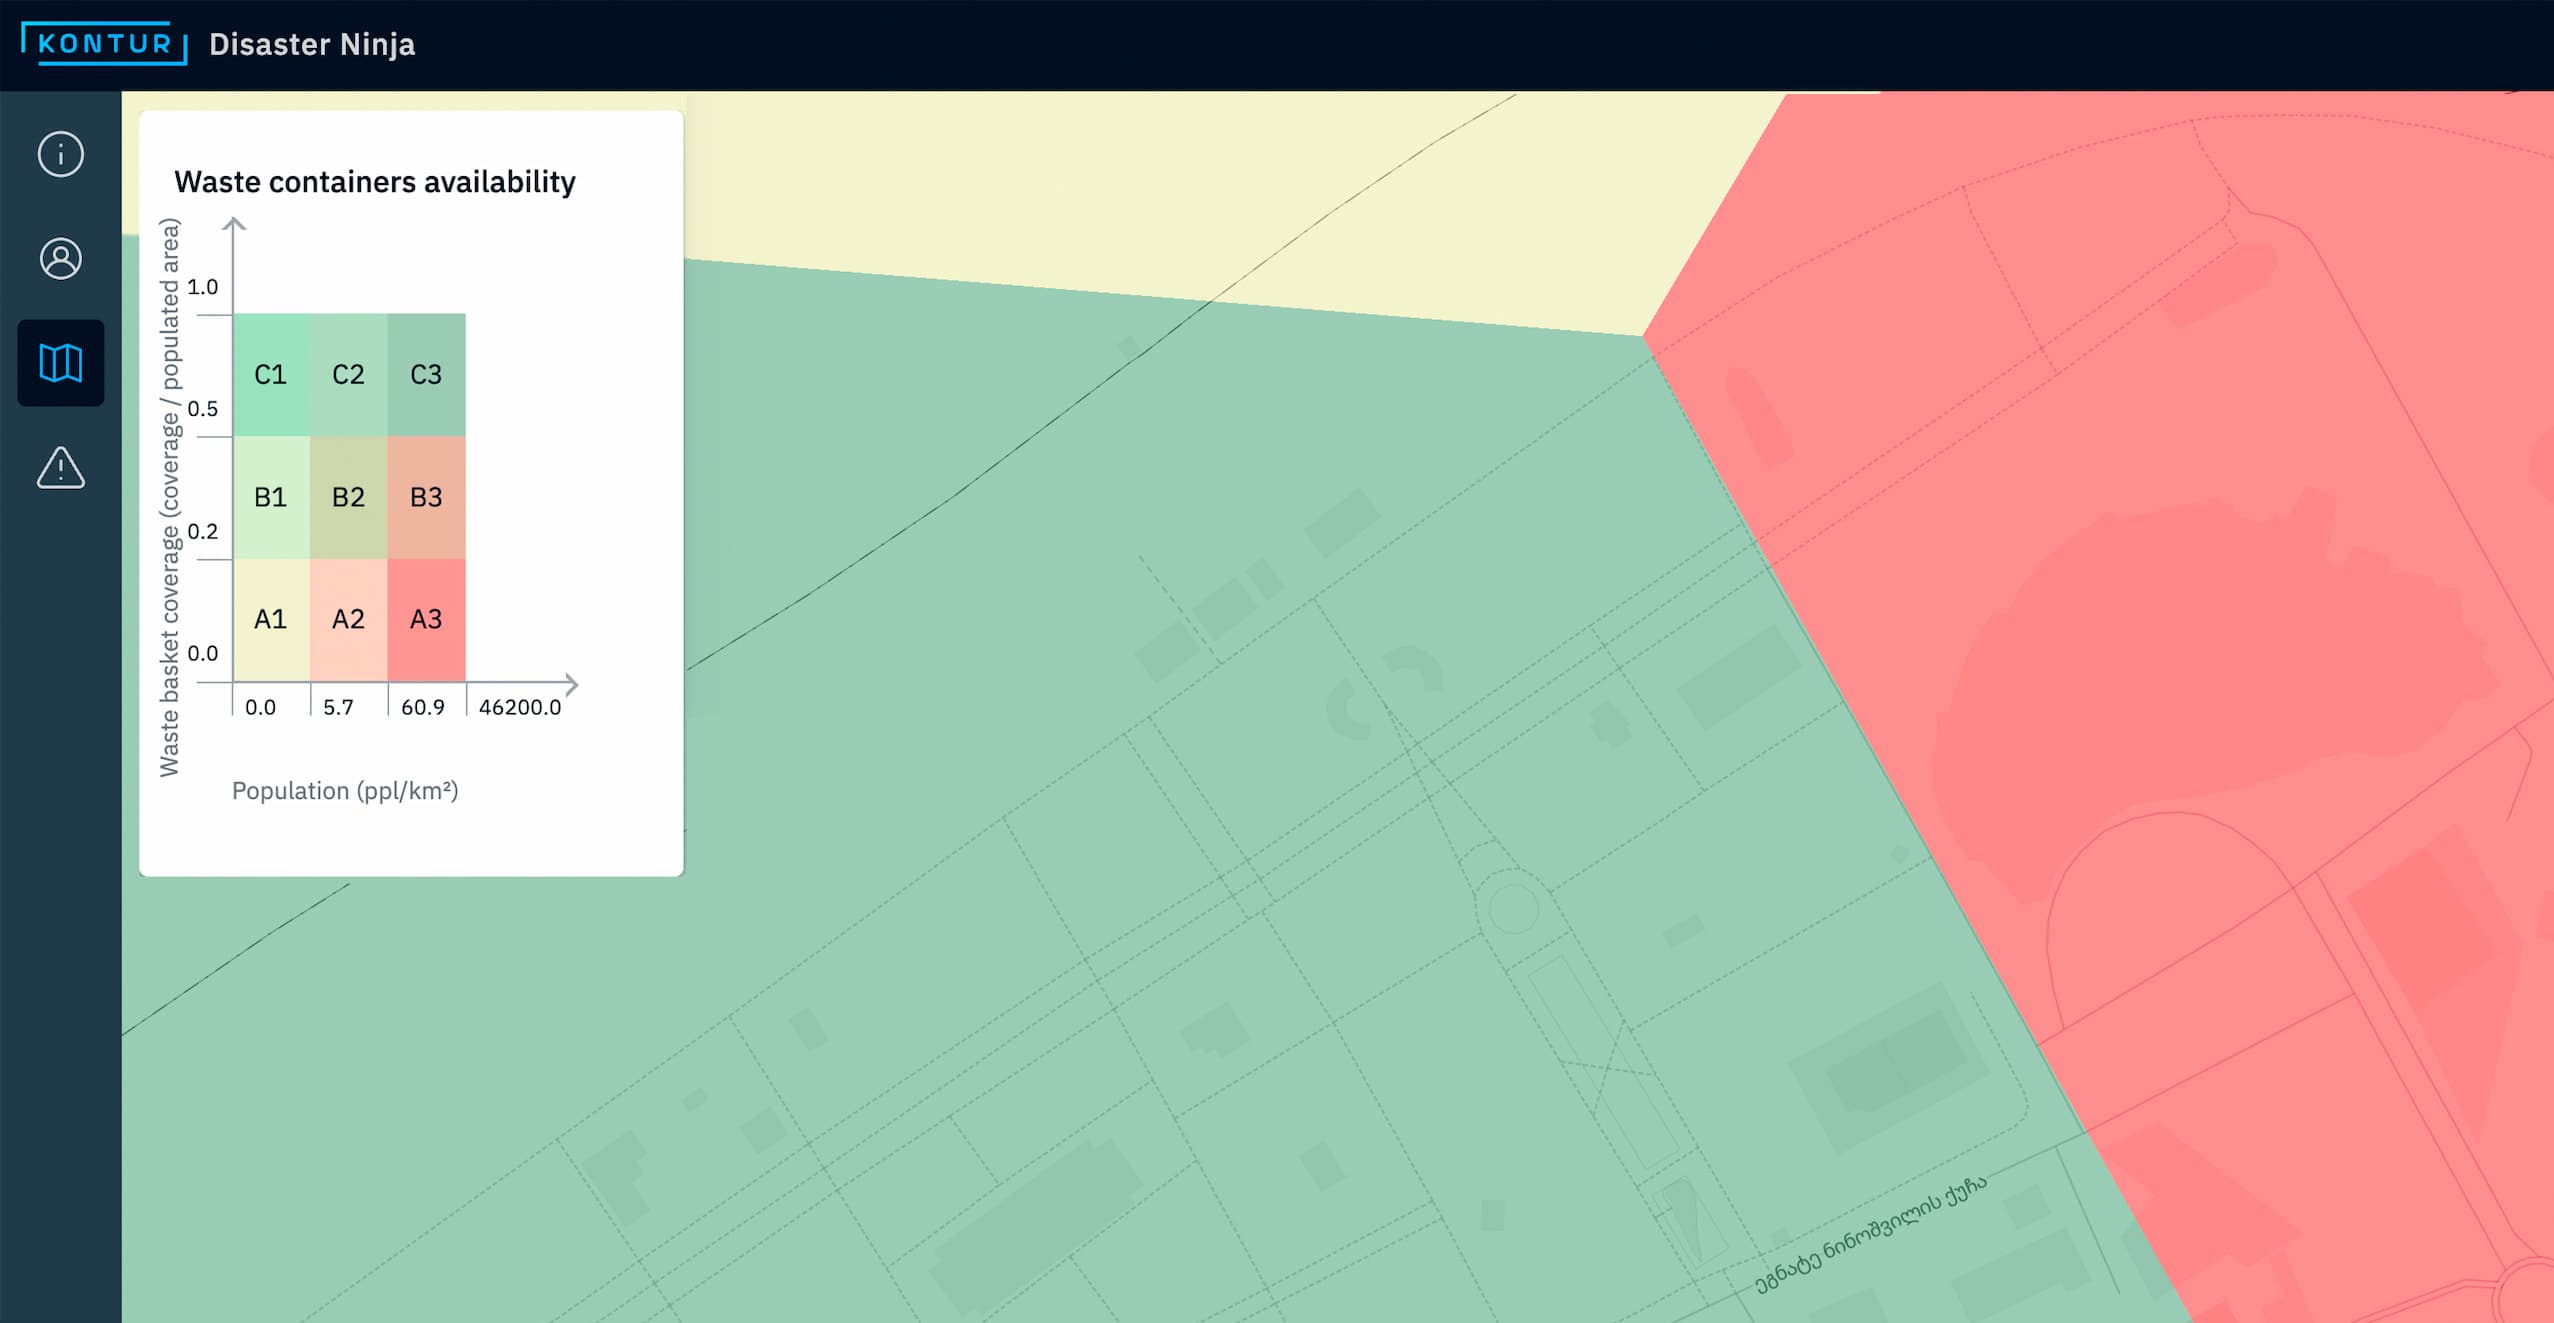
To visualize these data along with population density within one layer, we created a bivariate choropleth map with a simple color code to rank the zones.
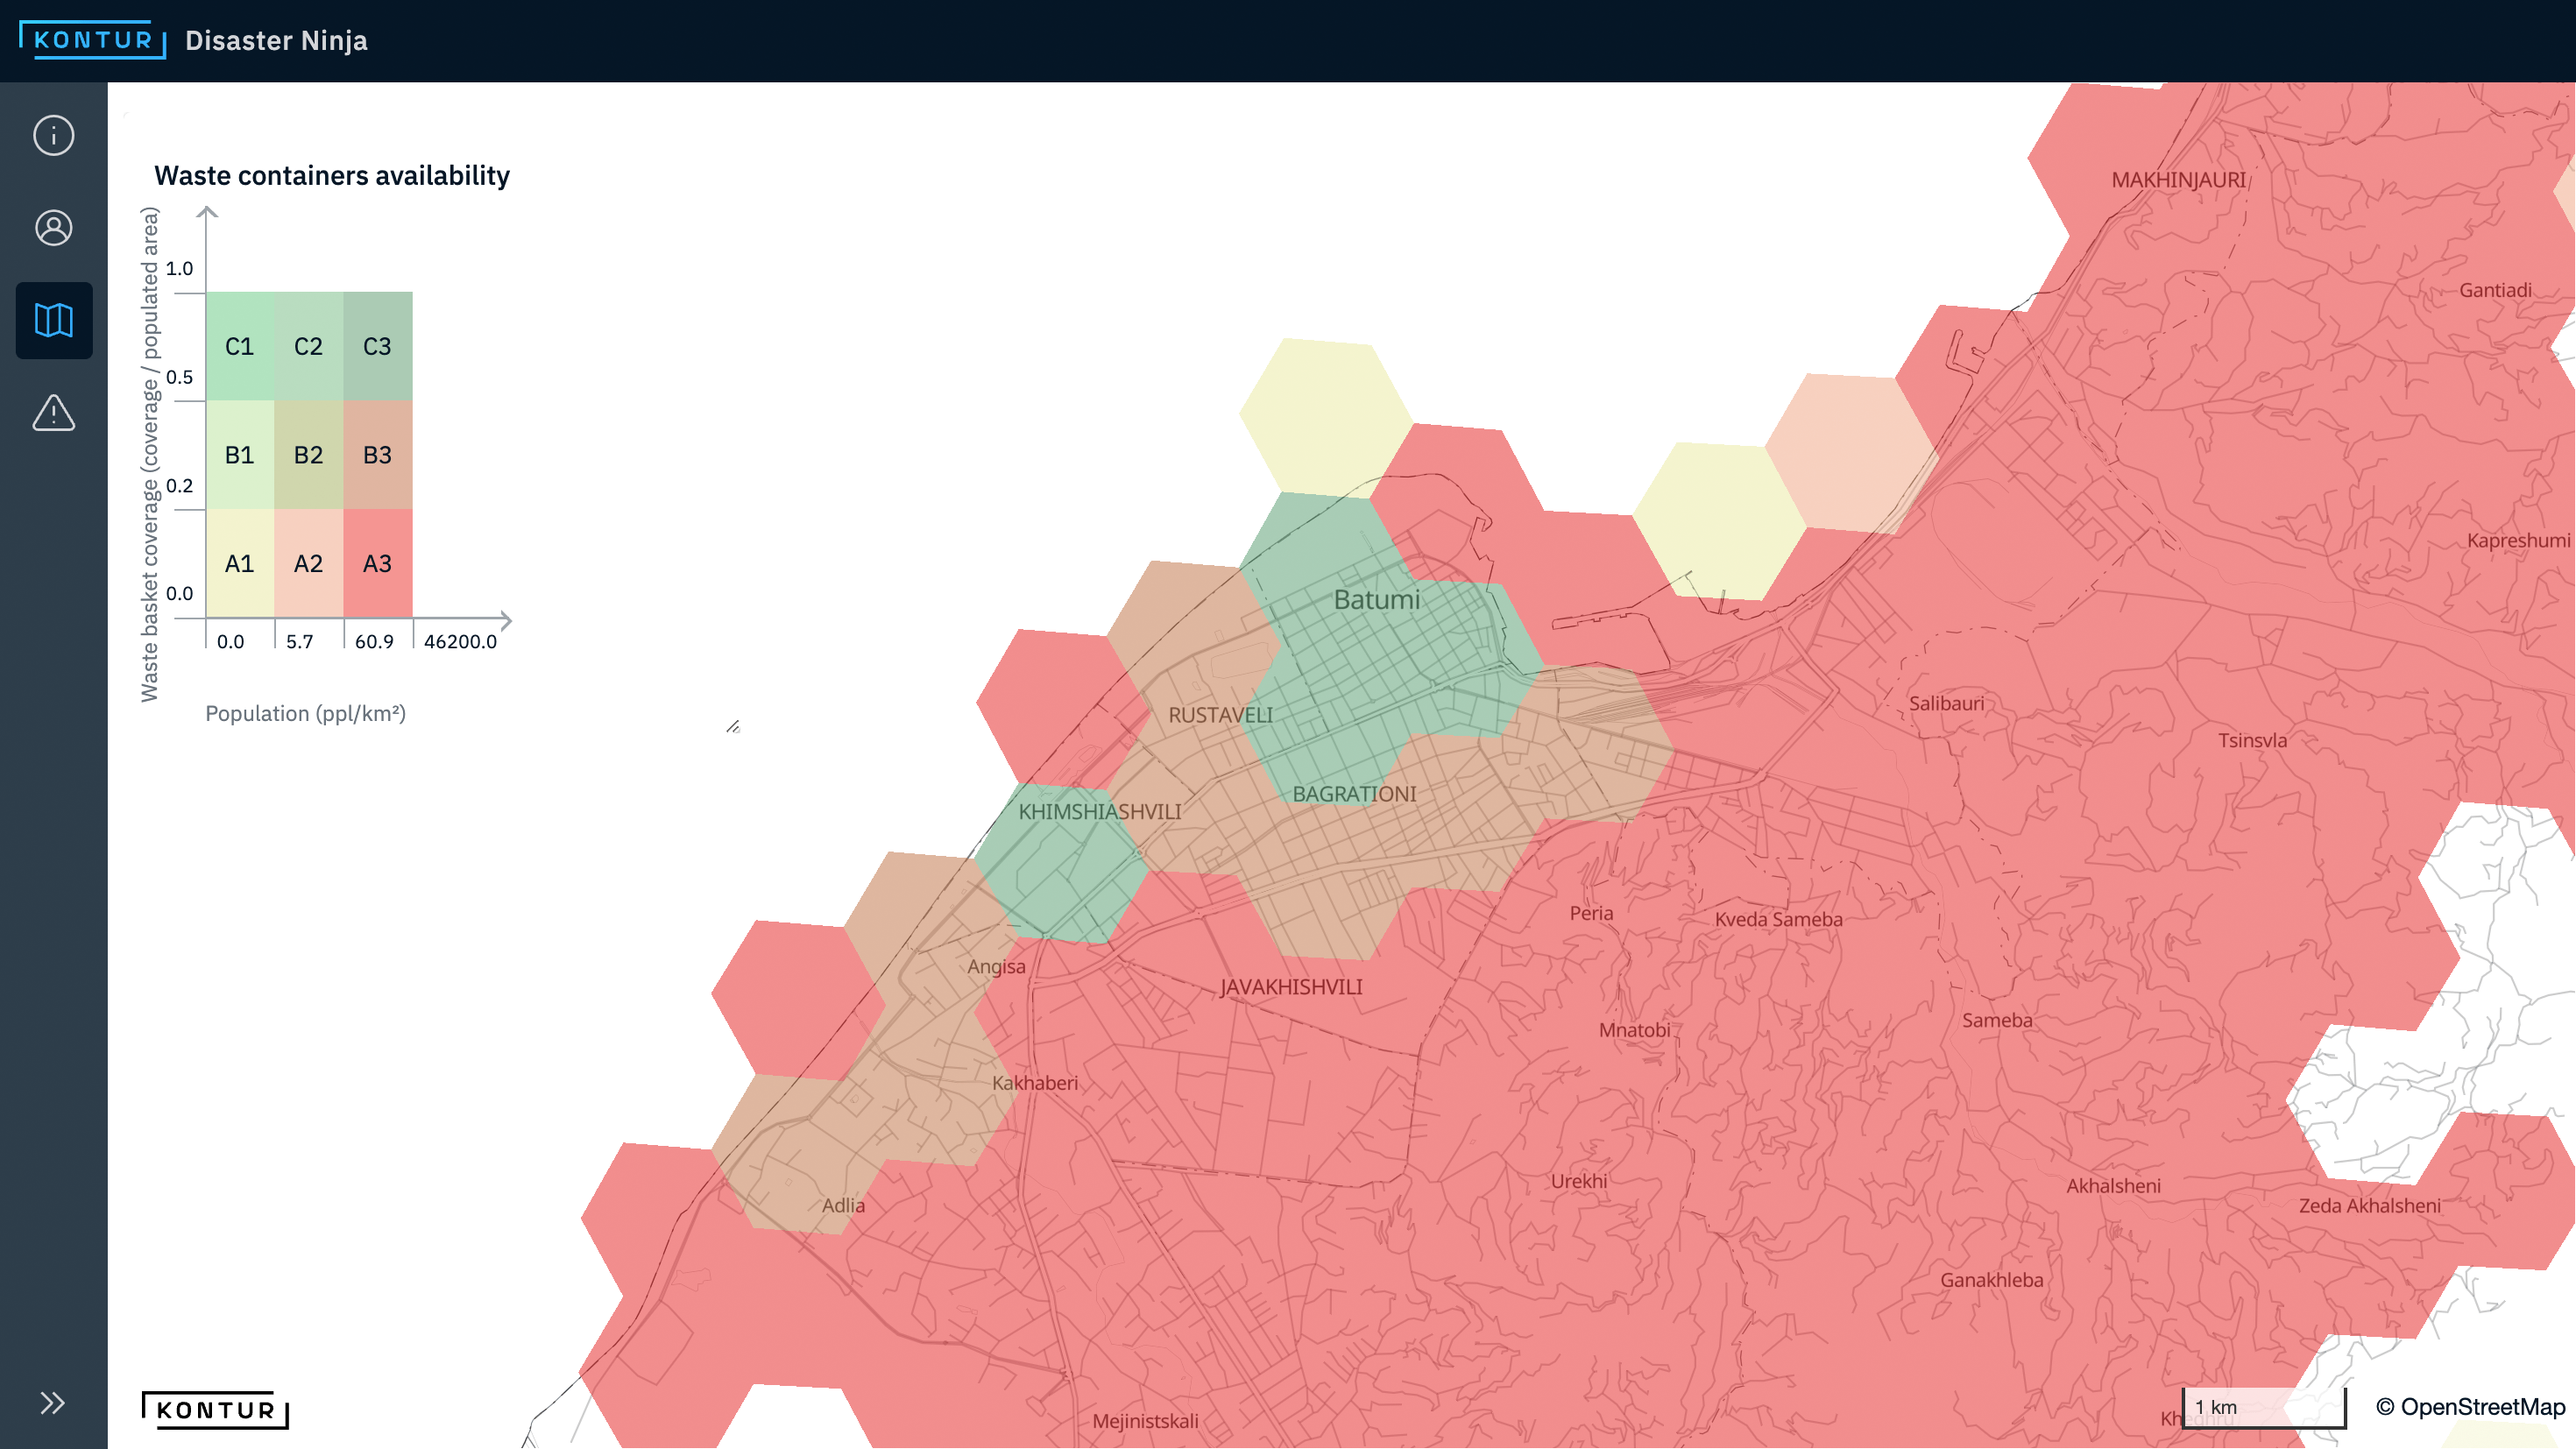
Population density is a crucial indicator for analyzing the optimal location of infrastructure assets. We also use it in our other maps in Disaster Ninja – from fire service station coverage to EV charger availability.
“My first impression is that the [Waste Container Availability] map tells you the truth – this is how things are at the moment. And then you want to zoom in and dig deeper.”
Volunteer initiative activist Peter Rudenko (@peter_hanzo)
Further improvements
- While you can use the map above to analyze the problem, increasing data resolution will enable a more granular understanding of optimal locations for new waste bins.
- To plan for waste bins, you need to consider both where people live and pedestrian flows around points of interest such as beaches and parks. Thus, at least three parameters can help find optimal waste bin locations: 1) the density of available waste bins, 2) the number of places of attraction that create high pedestrian density, and 3) population density. We are developing an MCDA (multi-criteria decision analysis) tool where you can select from multiple relevant indicators like these and assign weights to them for making more complex decisions.
- Information about the type of waste bins is essential as it can determine the problems to be solved. There are three general categories of bins in Batumi: 1) smaller waste baskets made of plastic, metal, or concrete, 2) waste disposal containers for mixed waste materials and 3) recycling containers for plastics.
- Adding the currently mapped waste bins as points on the map can further improve comprehension of the presented data.
- An option to display specific codes for areas covered by hexagons (e.g., H3 cell index) can help communicate and coordinate waste collection activities.
- After local verification that certain areas are well-mapped in OpenStreetMap, the analysis of new waste bin locations could focus exclusively on these areas. By contrast, the unmapped areas would be temporarily “hidden” on the map.
Conclusion
We can apply lessons learned from the waste basket placement challenge to any activities of infrastructure asset planning. City authorities need reliable data and practical tools for data analysis and visualization to make evidence-based decisions. While OpenStreetMap data is often incomplete, we can enrich it through our data services or use our clients’ datasets that, combined with our analytical capabilities, help achieve beneficial outcomes for municipalities, their residents, and society as a whole.
Explore the Waste Container Availability map on Disaster Ninja