Atlas login

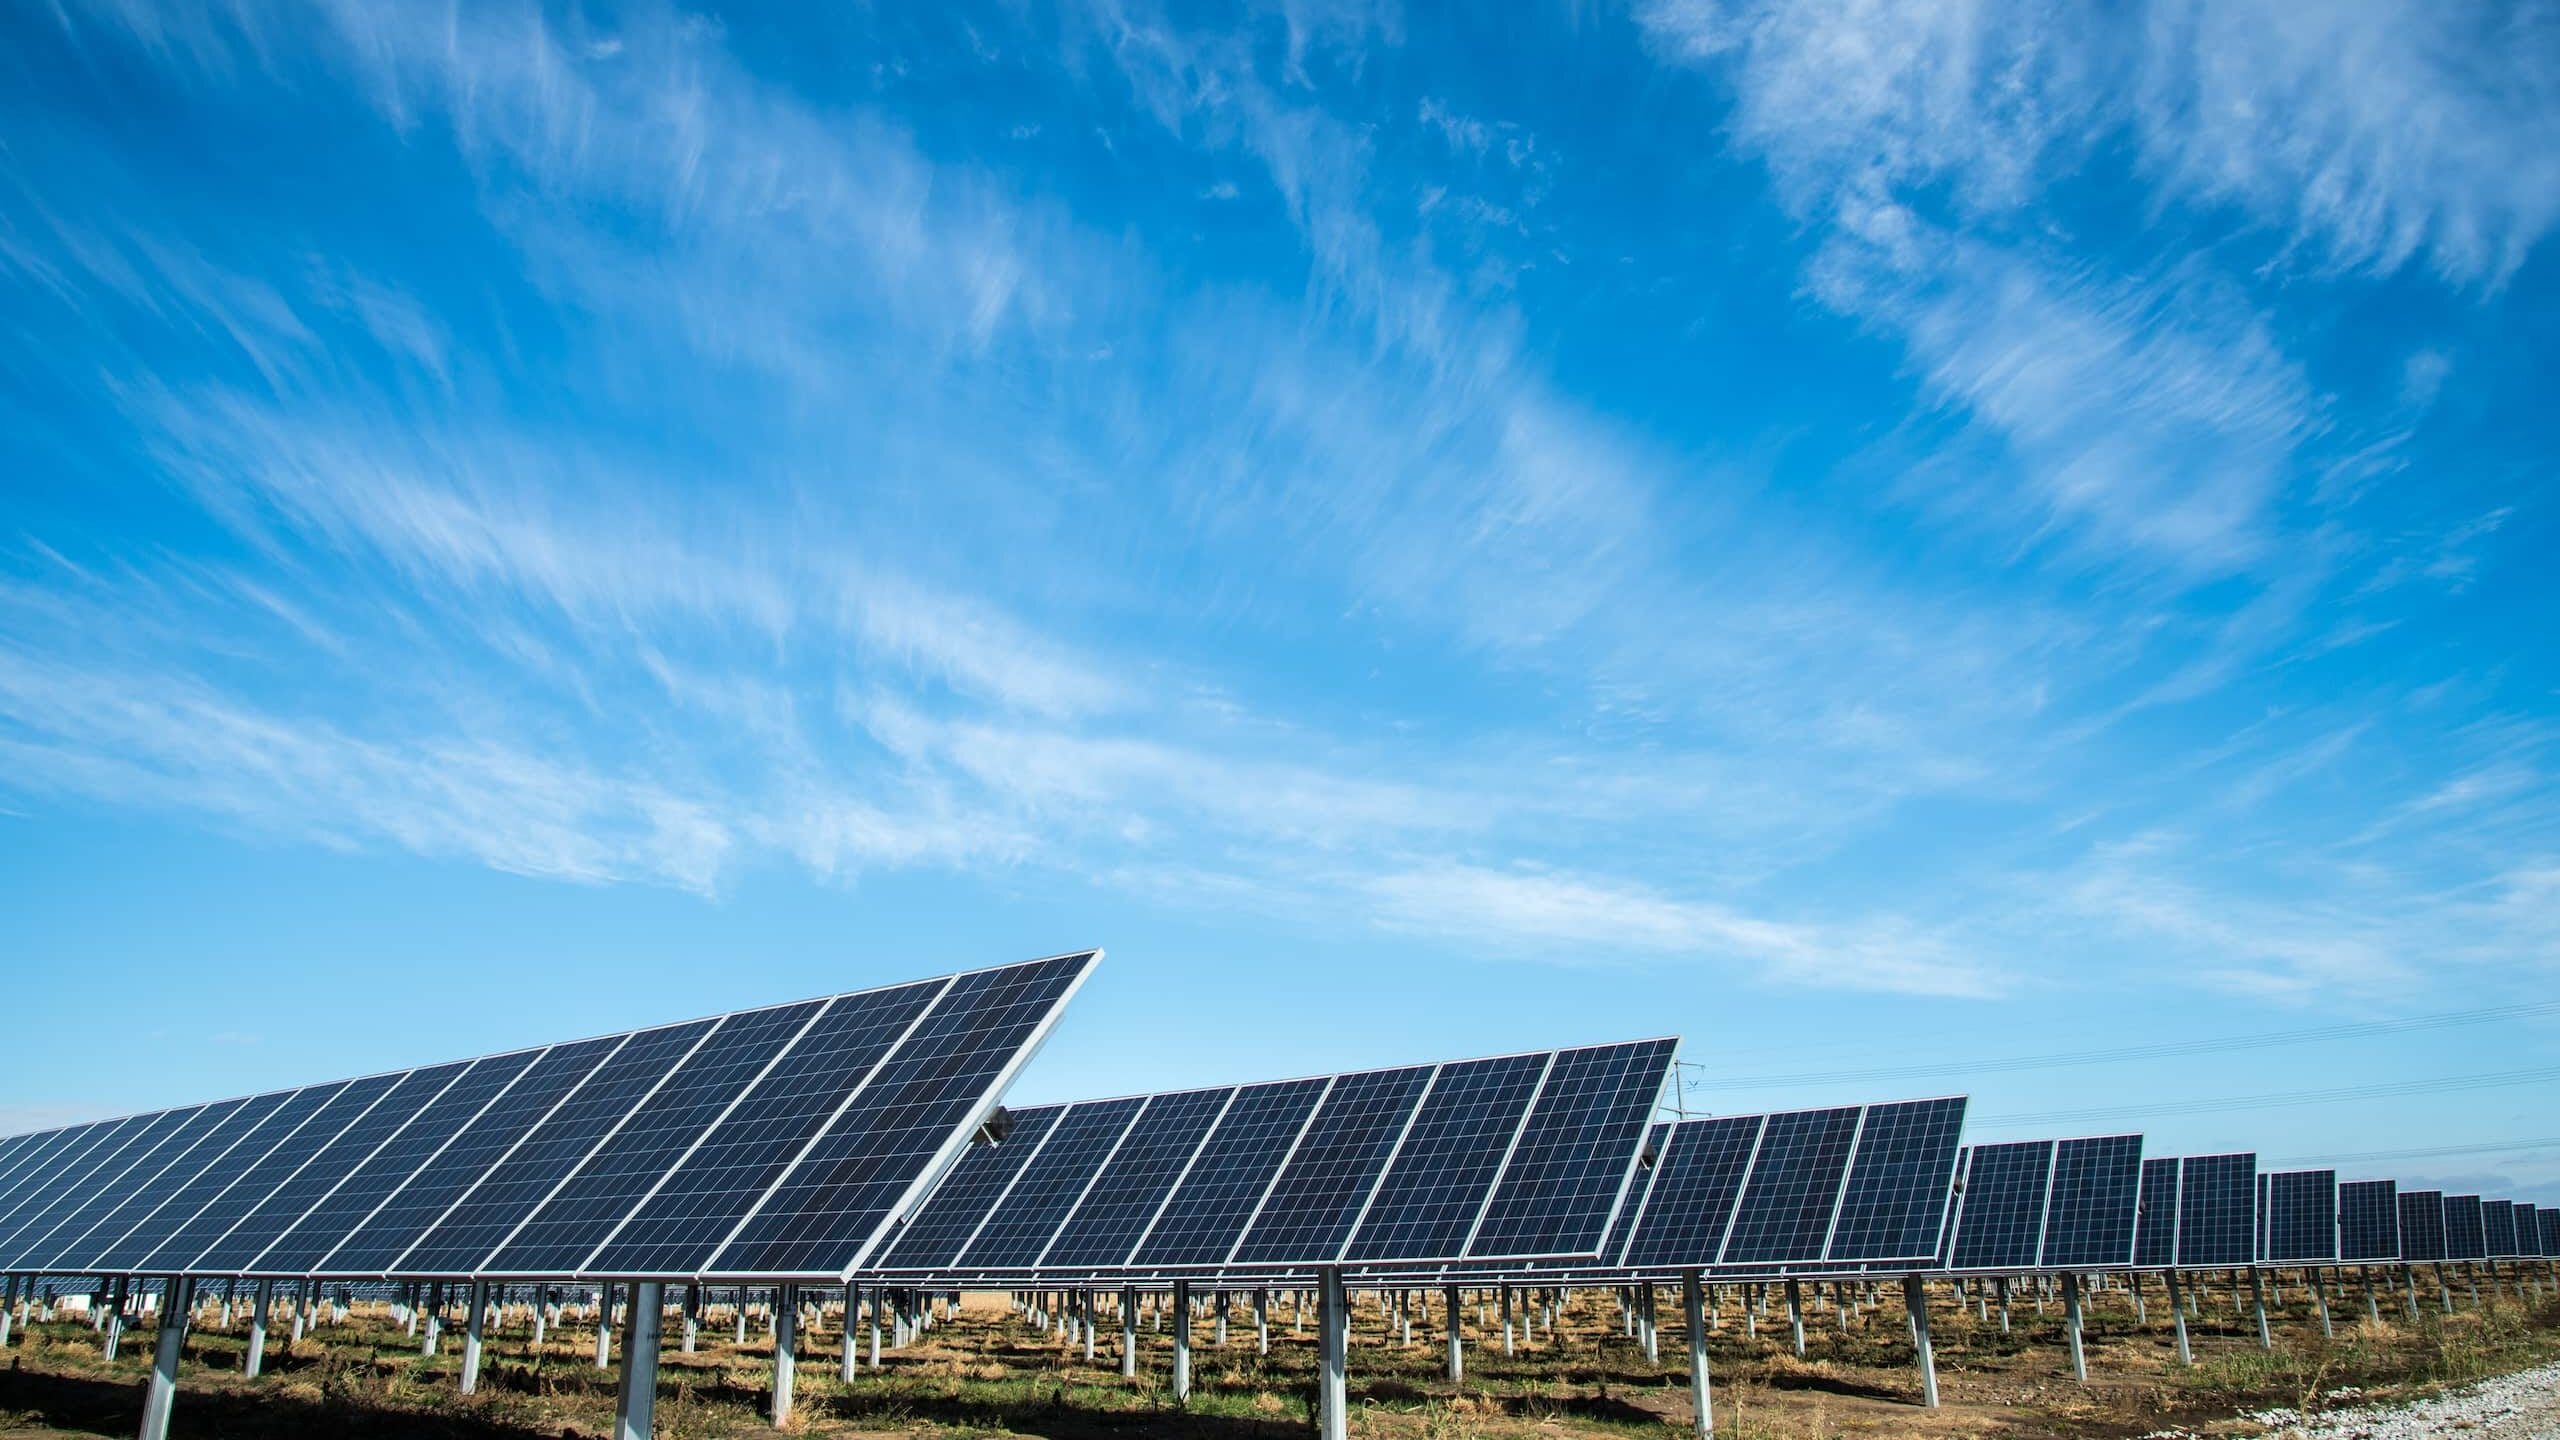
Various organizations in the humanitarian sector have used Kontur’s solutions for data-driven decision-making. Our platform is well-suited for customization and application in many domains. In this blog post, you can read about a solar farm site selection tool as an example of our custom solution.
Our approach
A common approach to solving site selection and similar problems in the geospatial industry is to combine multiple spatial datasets and calculate the estimated suitability of this combination of factors for the studied phenomena. The datasets in question may describe locations’ environmental, social, or economic conditions. With this approach, we can research problems in any domain, answering questions such as “where do we have a high risk of disasters with the greatest potential loss?”, “where is it better to build a new refugee camp?” or “what is the optimal location to build a solar plant?”
Each of these cases will require different factors, and the researcher should carefully select them using their expertise in the problem domain. Also, you need to determine which variables are more important and which are less so. Once you have these questions answered, combining the variables allows you to obtain a numerical summary for each location.
Let’s examine how we can determine places suitable for solar farm construction with the help of four indicators: horizontal solar irradiance, proximity to powerlines, proximity to power substations, and elevation slope. Each parameter affects the final estimation: a higher level of solar irradiance increases the system’s output, closer proximity to powerlines and power substations helps reduce the costs of infrastructure construction, and a flatter surface is preferable to steep slopes. Several other conditions make solar plant locations unsuitable, such as extreme average maximum and minimum temperatures and too close or too far distance to densely populated places, so we considered them as additional constraints.
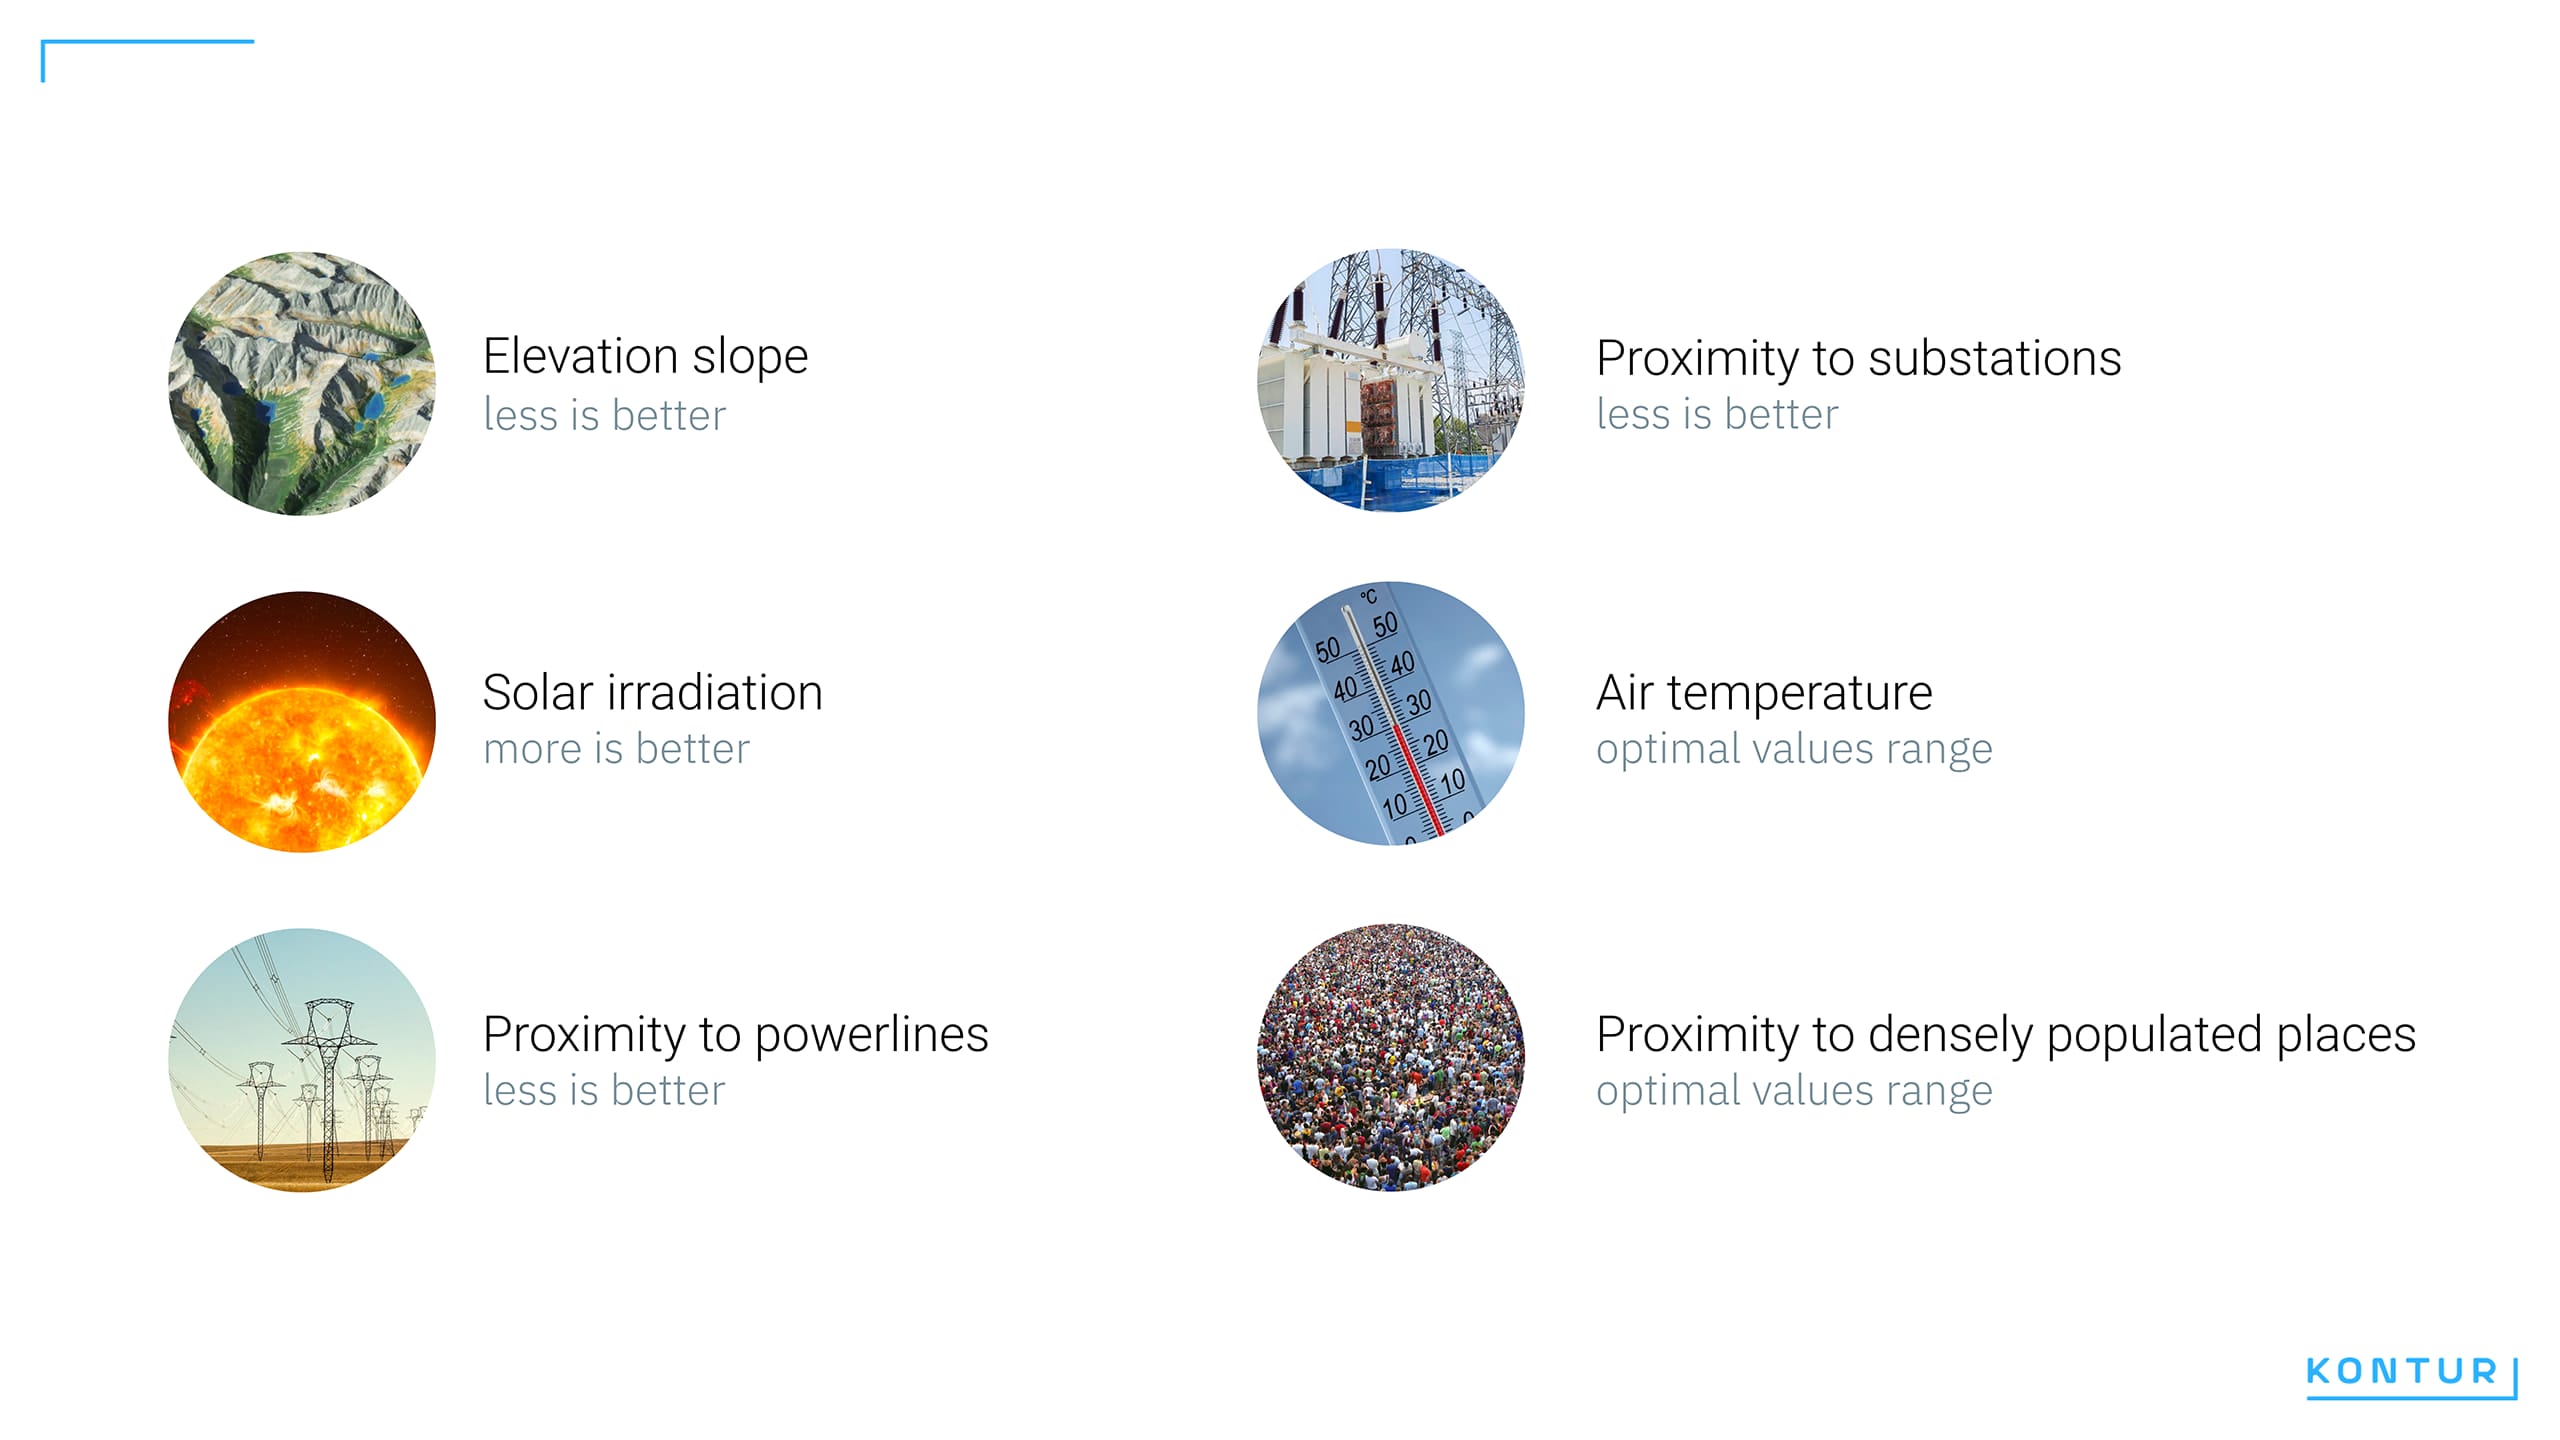
When combining indicators and constraints, we normalize each to a universal range and assign different weights determined by the level of importance: it is easier, for instance, to overcome surface slope problems than the lack of solar activity. Our model then calculates an index of suitability for potential solar farm sites, with scores ranging from 0 (not suitable) to 1 (perfect location).
After careful consideration, we have determined that areas with an index score of 0.6 or higher are good enough for solar farm development. However, we should note that lower scores do not mean it is impossible or unprofitable to build a solar farm in that location. It means comparably worse natural conditions, which larger investments in solar farm construction might overcome.
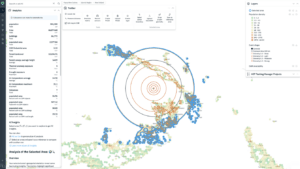
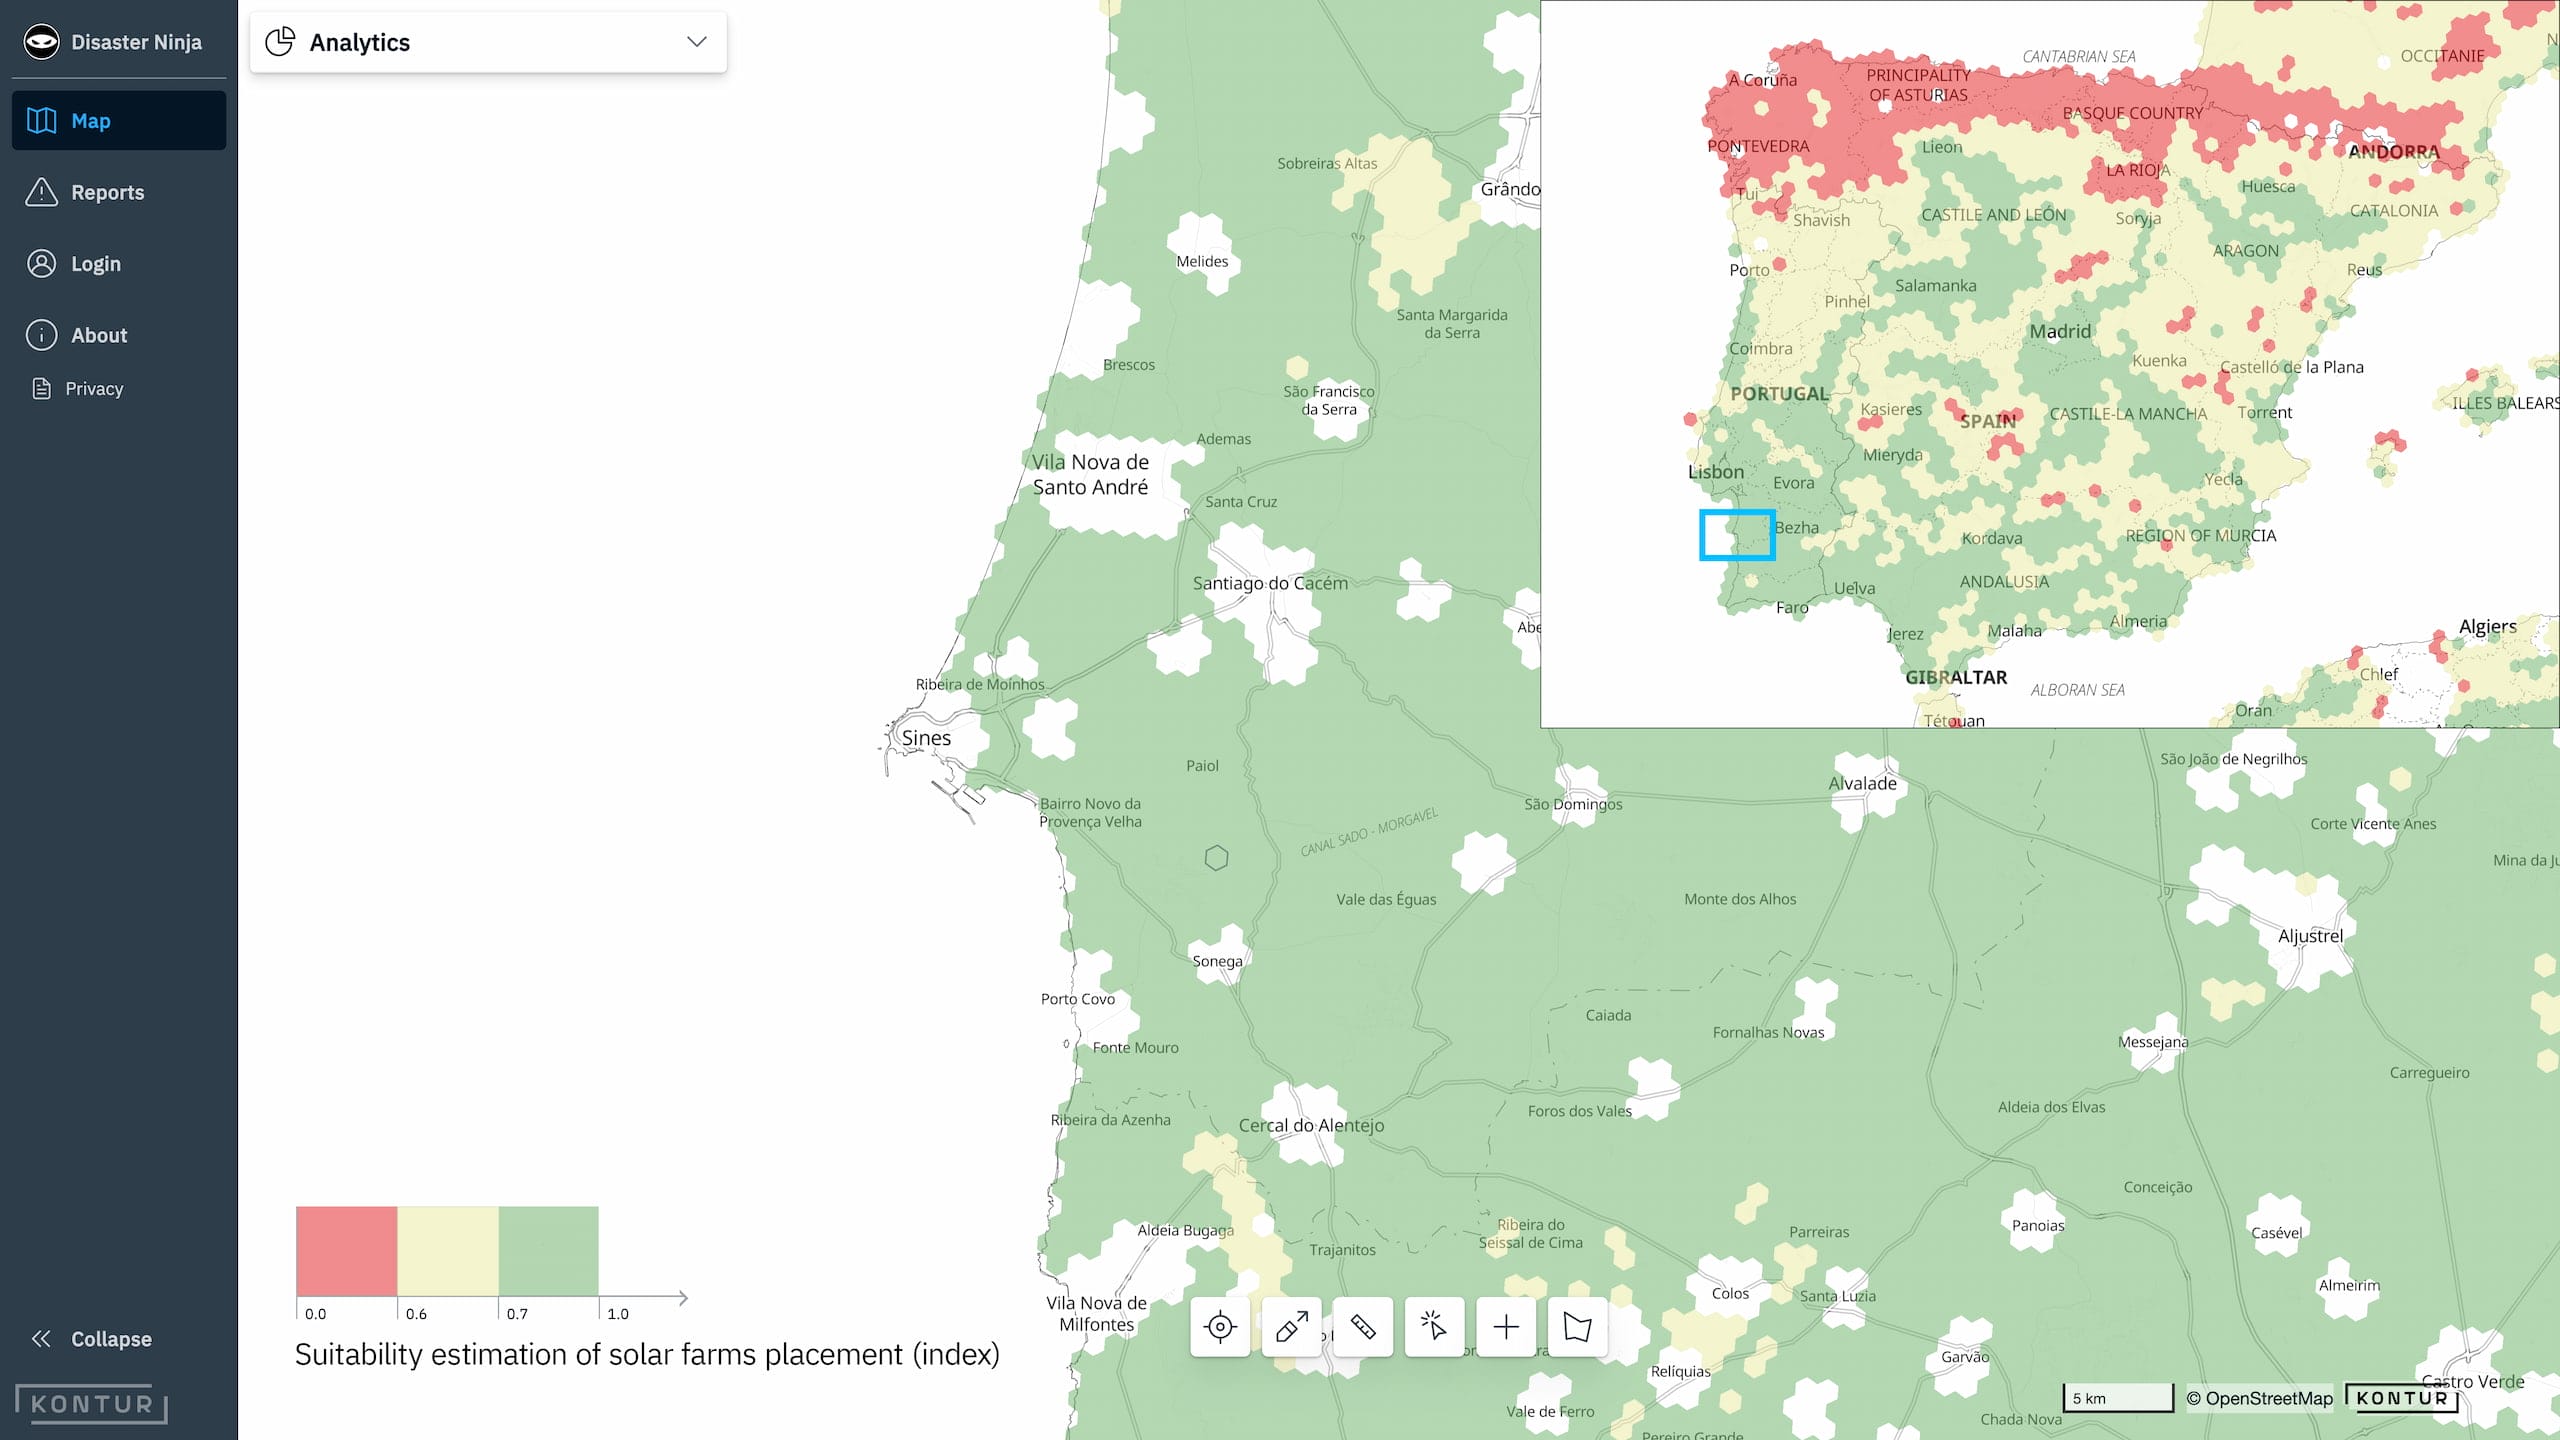
Kontur Solar Farm Suitability Areas map
What resulted from our work with the data analysis and visualization is a high-resolution global layer containing numerical estimation of solar farm placement suitability for each square kilometer of the Earth. The lower-resolution map below offers a quick interactive overview, showing the global distribution of well-suited areas to place solar farms. Here, each hexagon has an area of approximately 1770 km2 and a color defined by the share of its area with a suitability index value for solar farm placement higher than 0.6.
It is possible to tune our model with new data or changed requirements fastly. We consciously didn’t include economic factors like land price or land use restrictions as they are very dynamic, and their sources and specifics could vary significantly from country to country. For commercial customers, we can refine the model using more specific datasets.
Real case
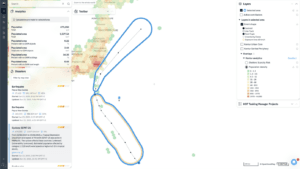
Let’s use the new layer to illustrate a recent real-life case in the public domain. Portugal is starting to build one of the largest solar plants in Europe, the 1.2GW Fernando Pessoa project, due in 2025. The Kontur Solar Farm Suitability Areas map showed that the photovoltaic facility’s location in the Santiago de Cacém municipality, near Sines, was rated above 0.6 and thus was highly suitable for solar plant development (see the local map below).
There is significant potential for growth in the solar energy sector, and geospatial analysis tools greatly help realize this potential. Solar energy production depends on location to a large extent. By providing precise data on location quality and suitability, geospatial tools can help companies make better decisions about where and why to construct new solar plants for a faster transition to the clean-energy world.
Are you interested in our geospatial solutions?
Explore Kontur Atlas at https://www.kontur.io/solutions/atlas/