Atlas login

By Yevhen Kyslomed, Alexander Rublewski and Misha Malikin
Finding a perfect location with Kontur technology and publicly available data
Delivery services are in all-time high demand nowadays. Opening a new retail store or a restaurant has always required choosing a location wisely. This article will show how Kontur technology can help find the most effective sites even before you start shopping for your new business space. Using geospatial data analysis can maximize logistic benefits and help avoid starting your business out of customers’ reach.
The Use Case
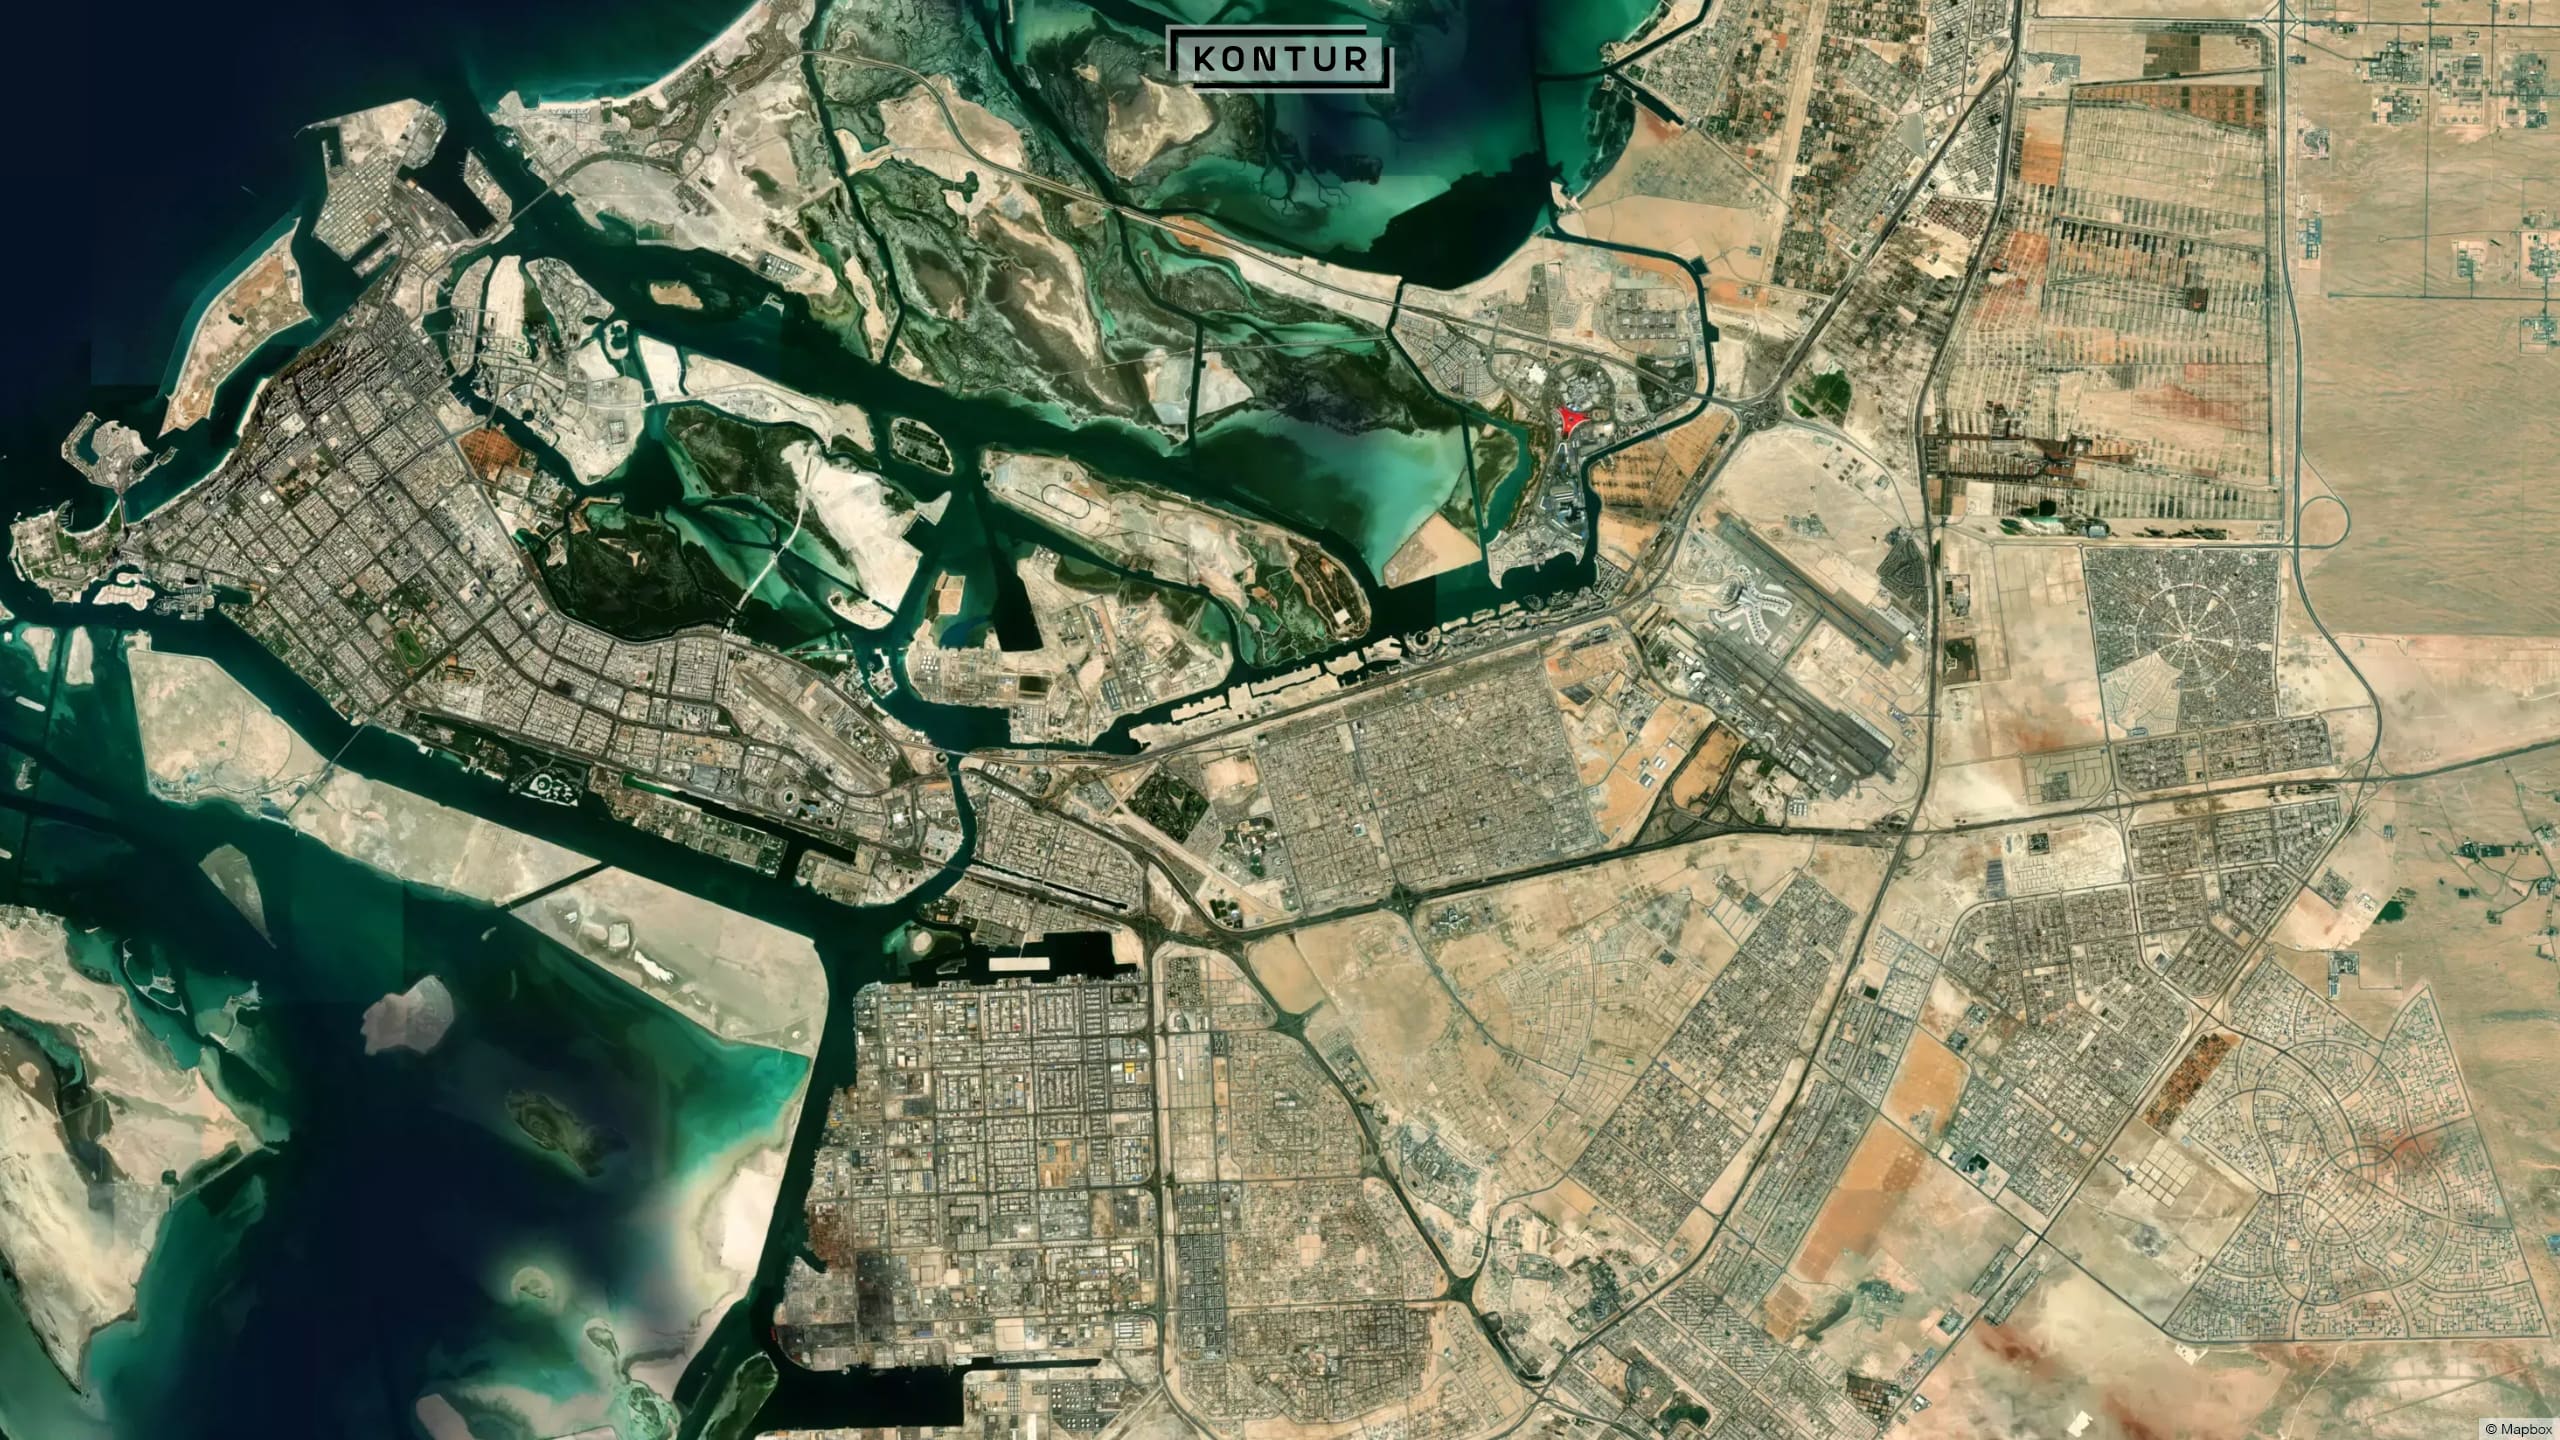
Let’s suppose you want to open a cafe in Abu Dhabi. To maximize the chance of success, you would expect a perfect location to have certain features:
• a maximum population density and footfall in the area,
• presence of competitors to use the overflow from existing businesses.
The Solution
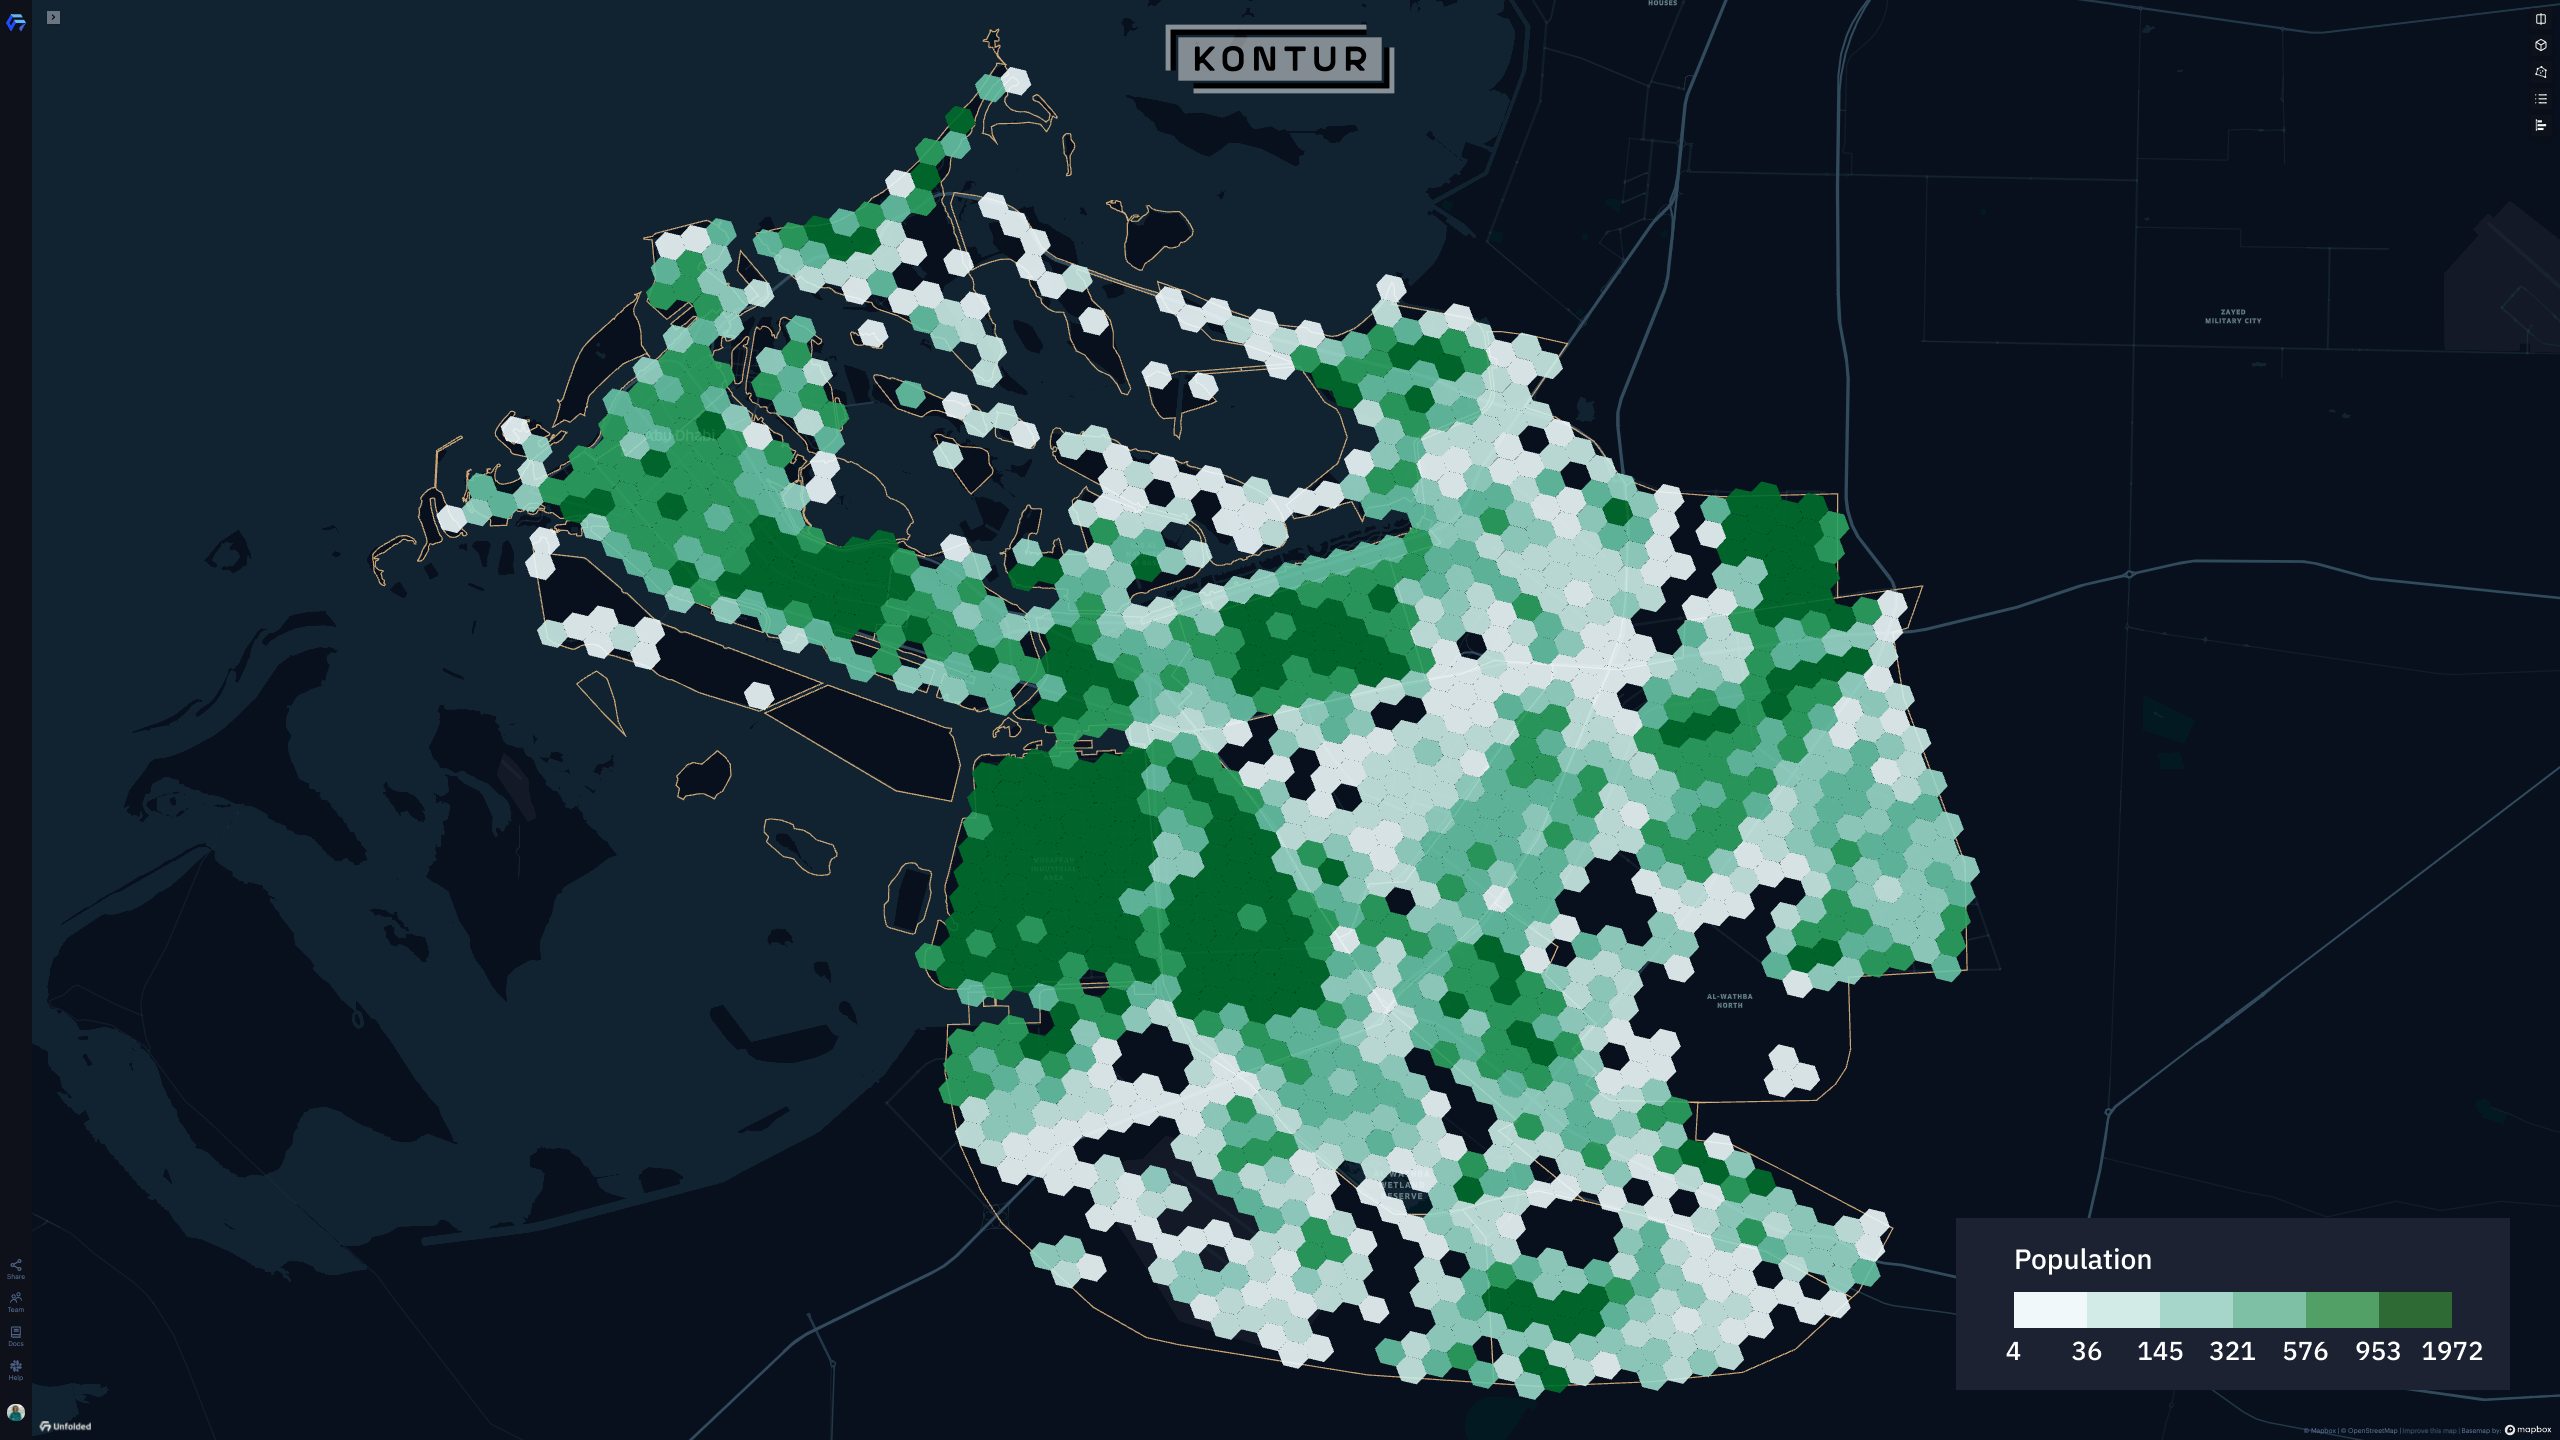
Population Data
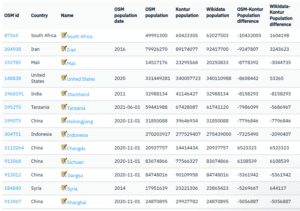
The cornerstone of our analysis is population data. To define the most densely populated areas, we used the Kontur Population as the baseline dataset. For such rapidly growing cities as Abu Dhabi, it’s crucial to weigh the existing population density data against emerging districts to find probable data gaps. We used machine learning algorithms to detect buildings and their heights in residential areas. This allowed us to create a custom dataset for this case by distributing the population proportionately to the capacity of buildings in the next step.
Catering Facilities
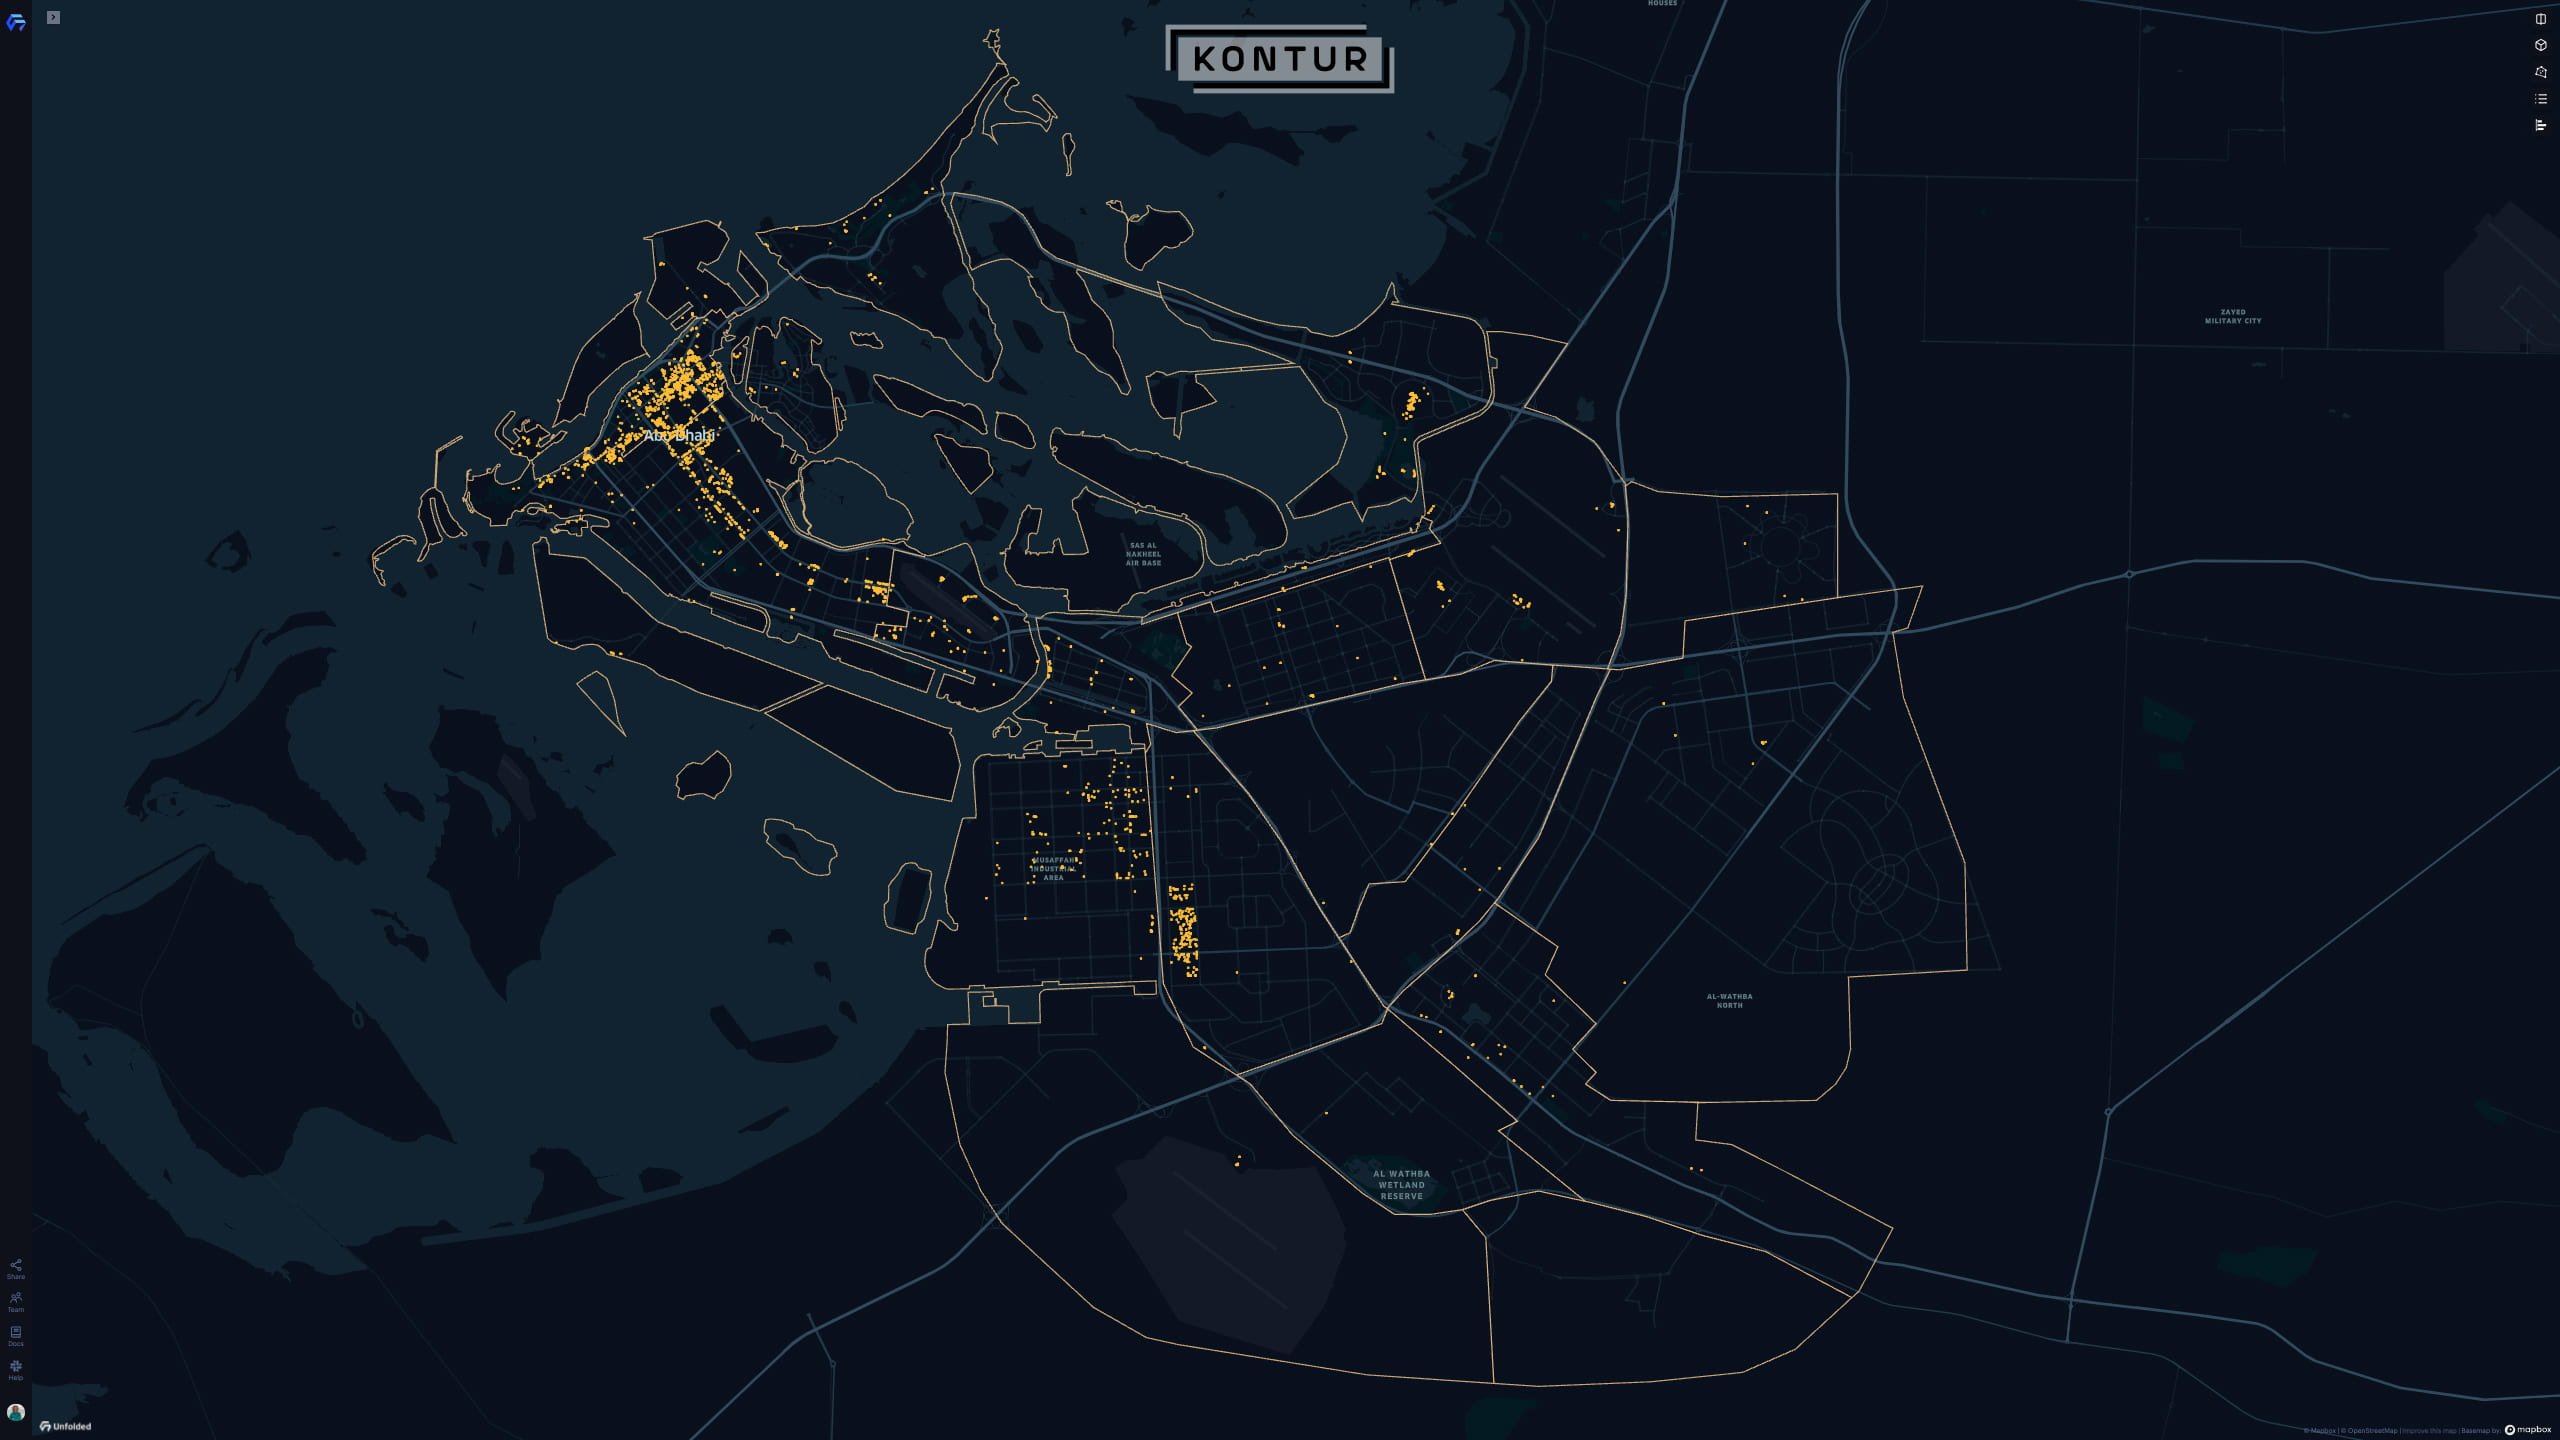
Knowing where the competition is helps us quickly visualize the areas where people are most likely to look for a place to eat. We can also benefit from using the customer overflow from existing businesses nearby.
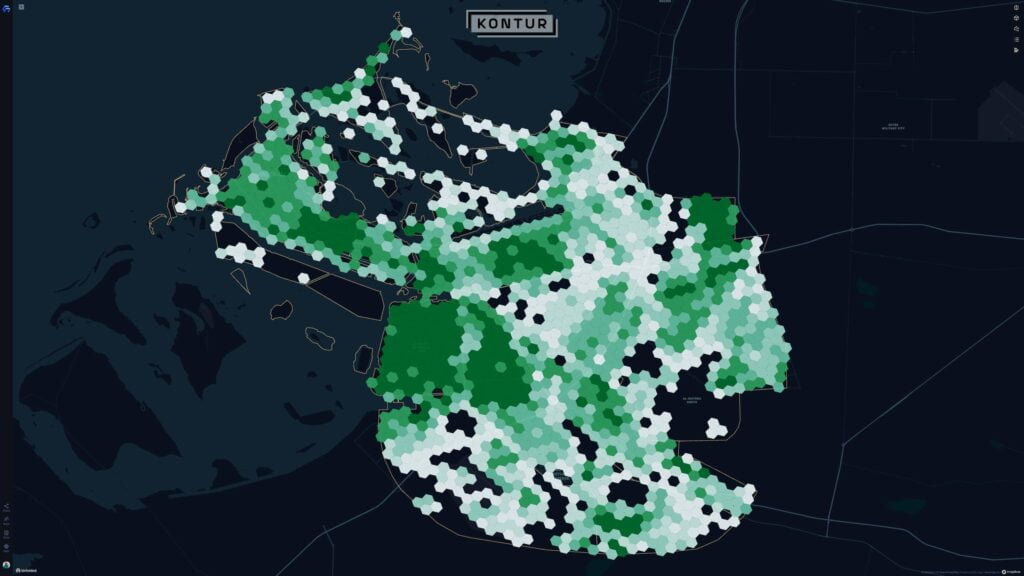
Kontur chose OpenStreetMap as a data source to extract locations of cafes and restaurants:
We cluster these locations to have a clearer perception of popular areas at any scale:
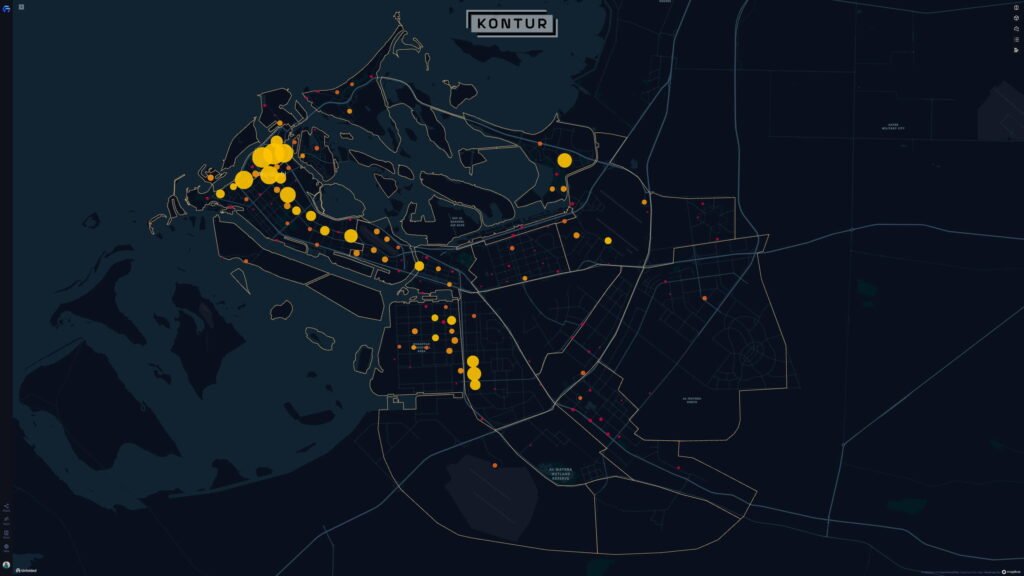
Overlaying catering facilities data with population density allows for more accurate site selection:
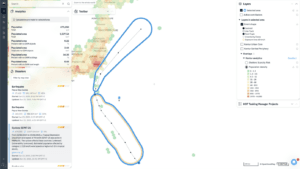
To see both datasets within one layer we can create a bivariate choropleth map ranking the areas with a simple color code:
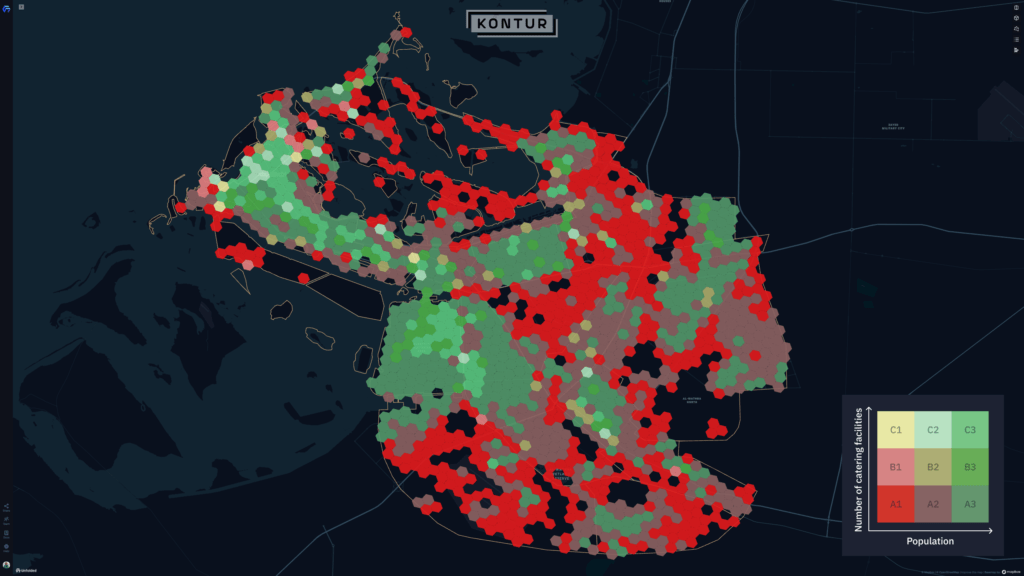
The map above shows areas with the highest population and number of catering facilities at the same time (light green) and places with the least population density and the absence of restaurants (bright red).
Customer Coverage
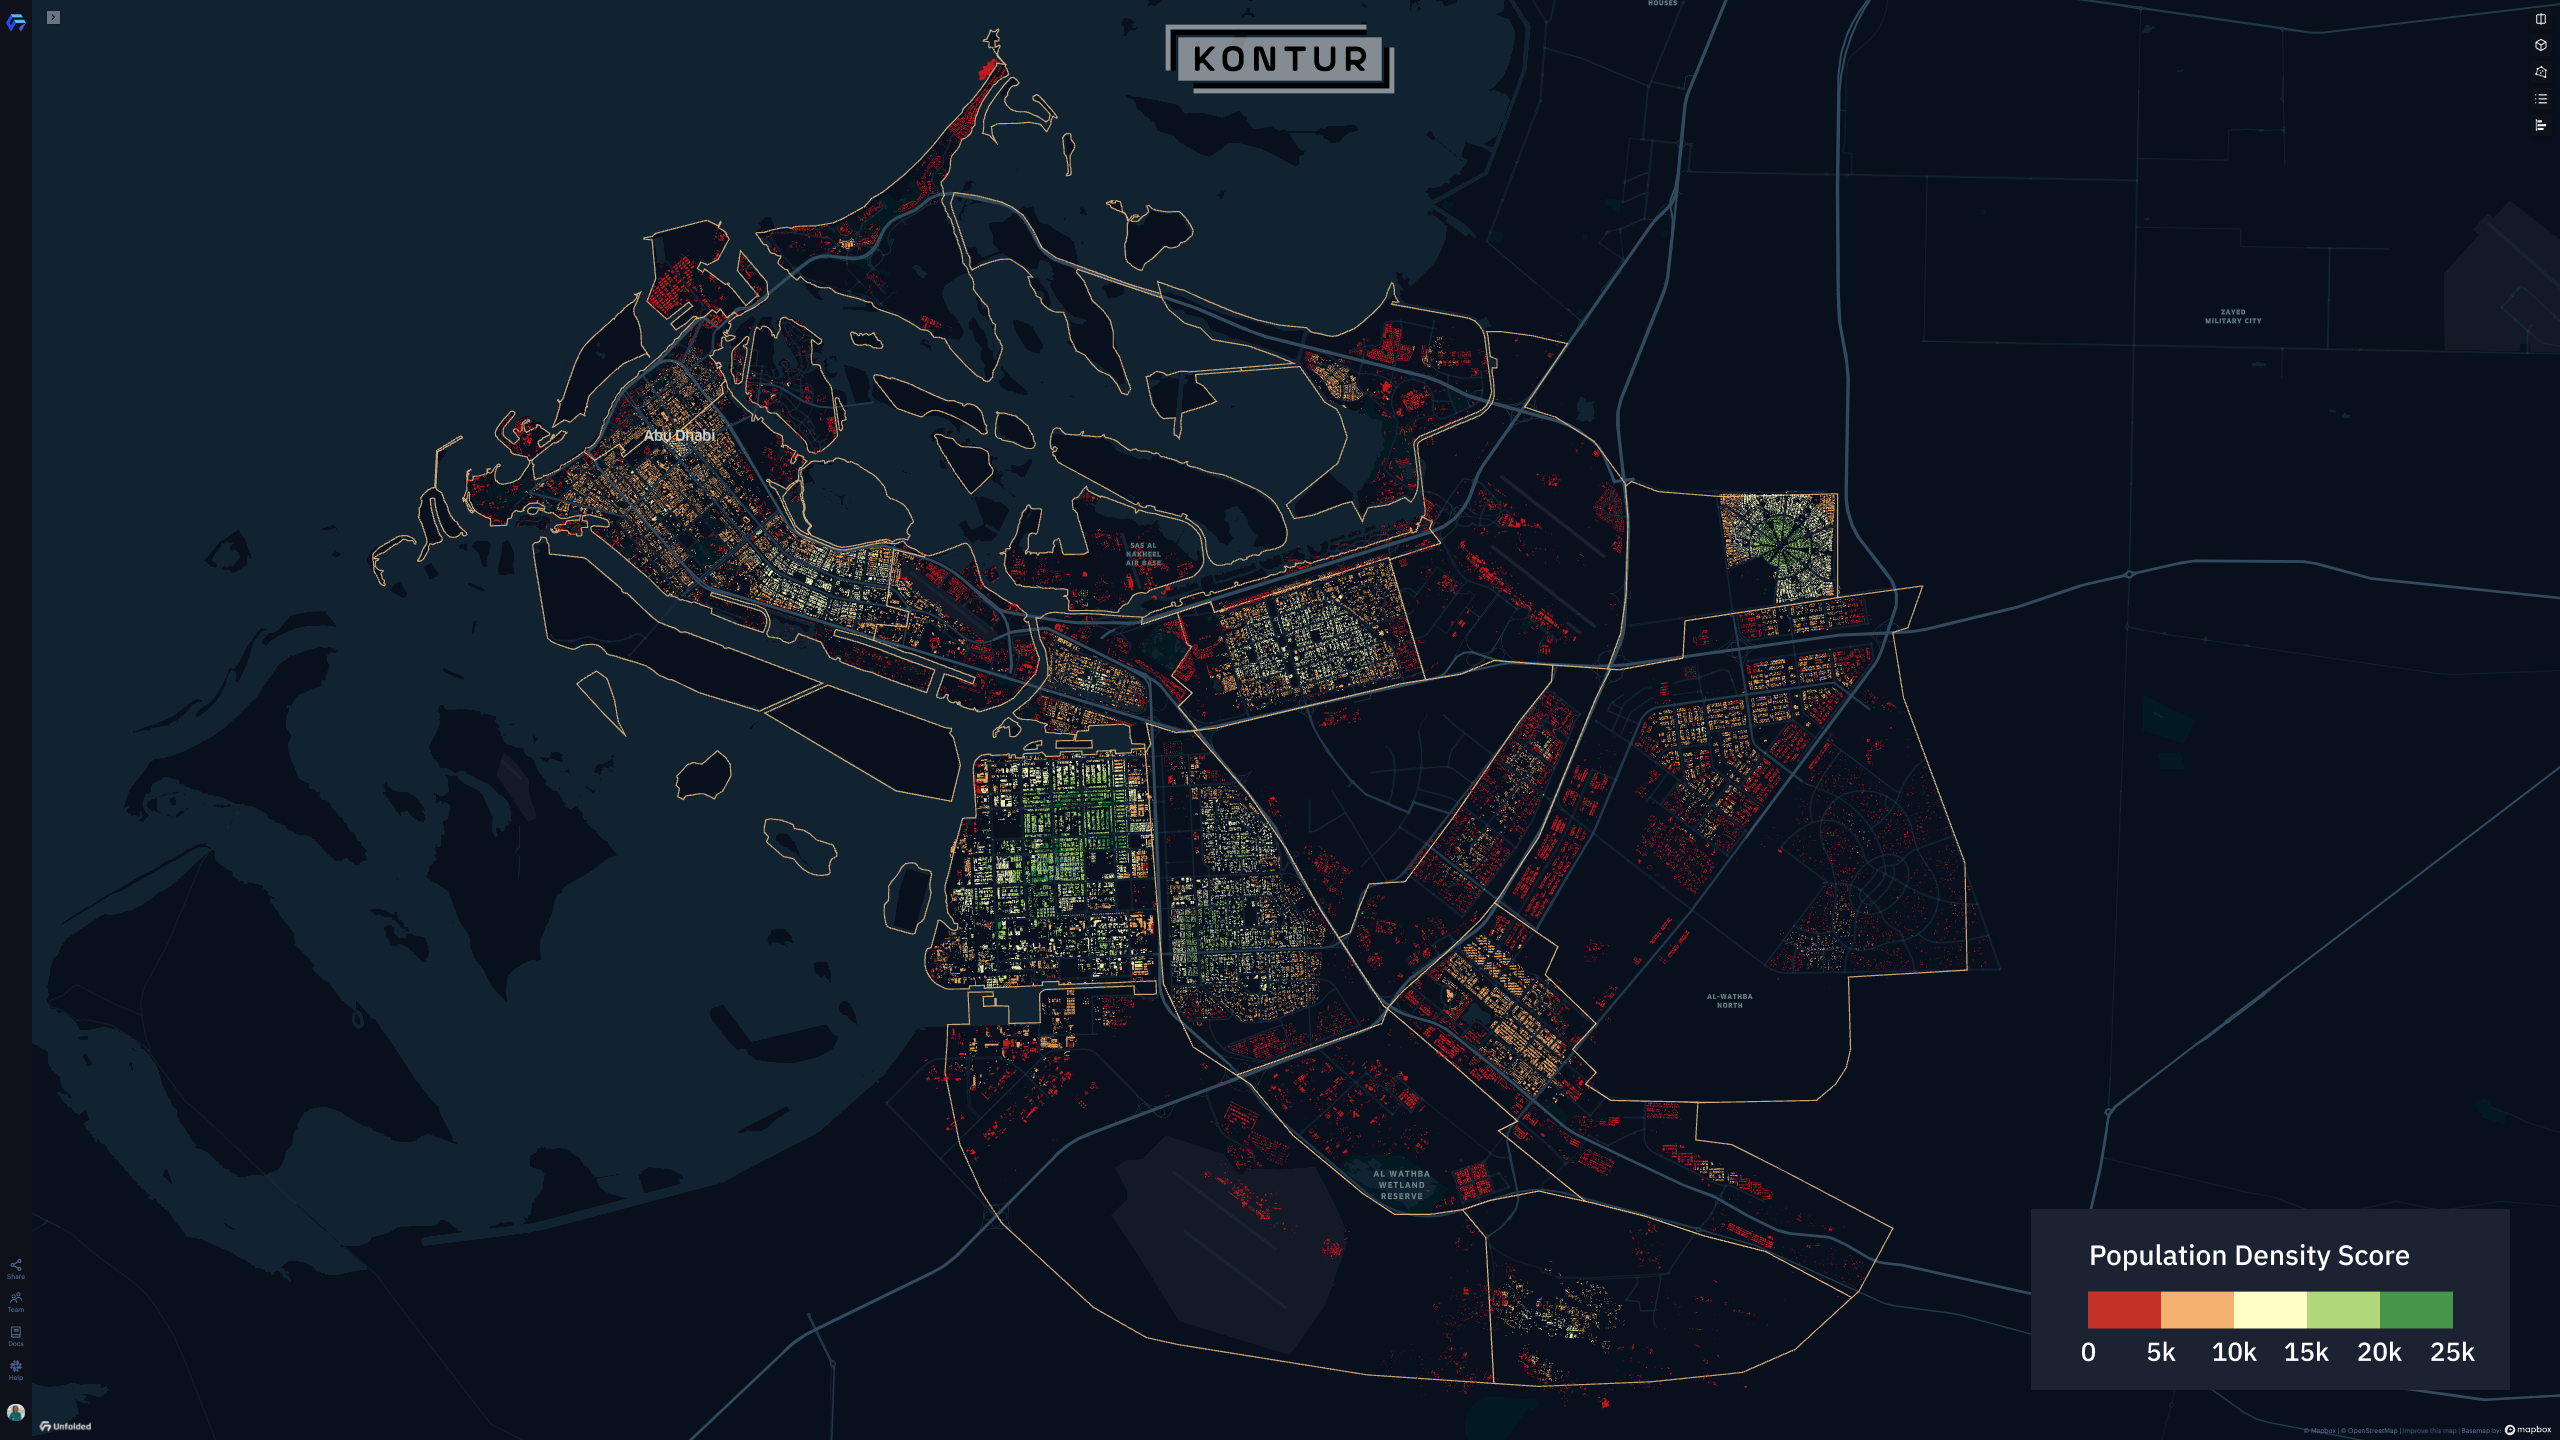
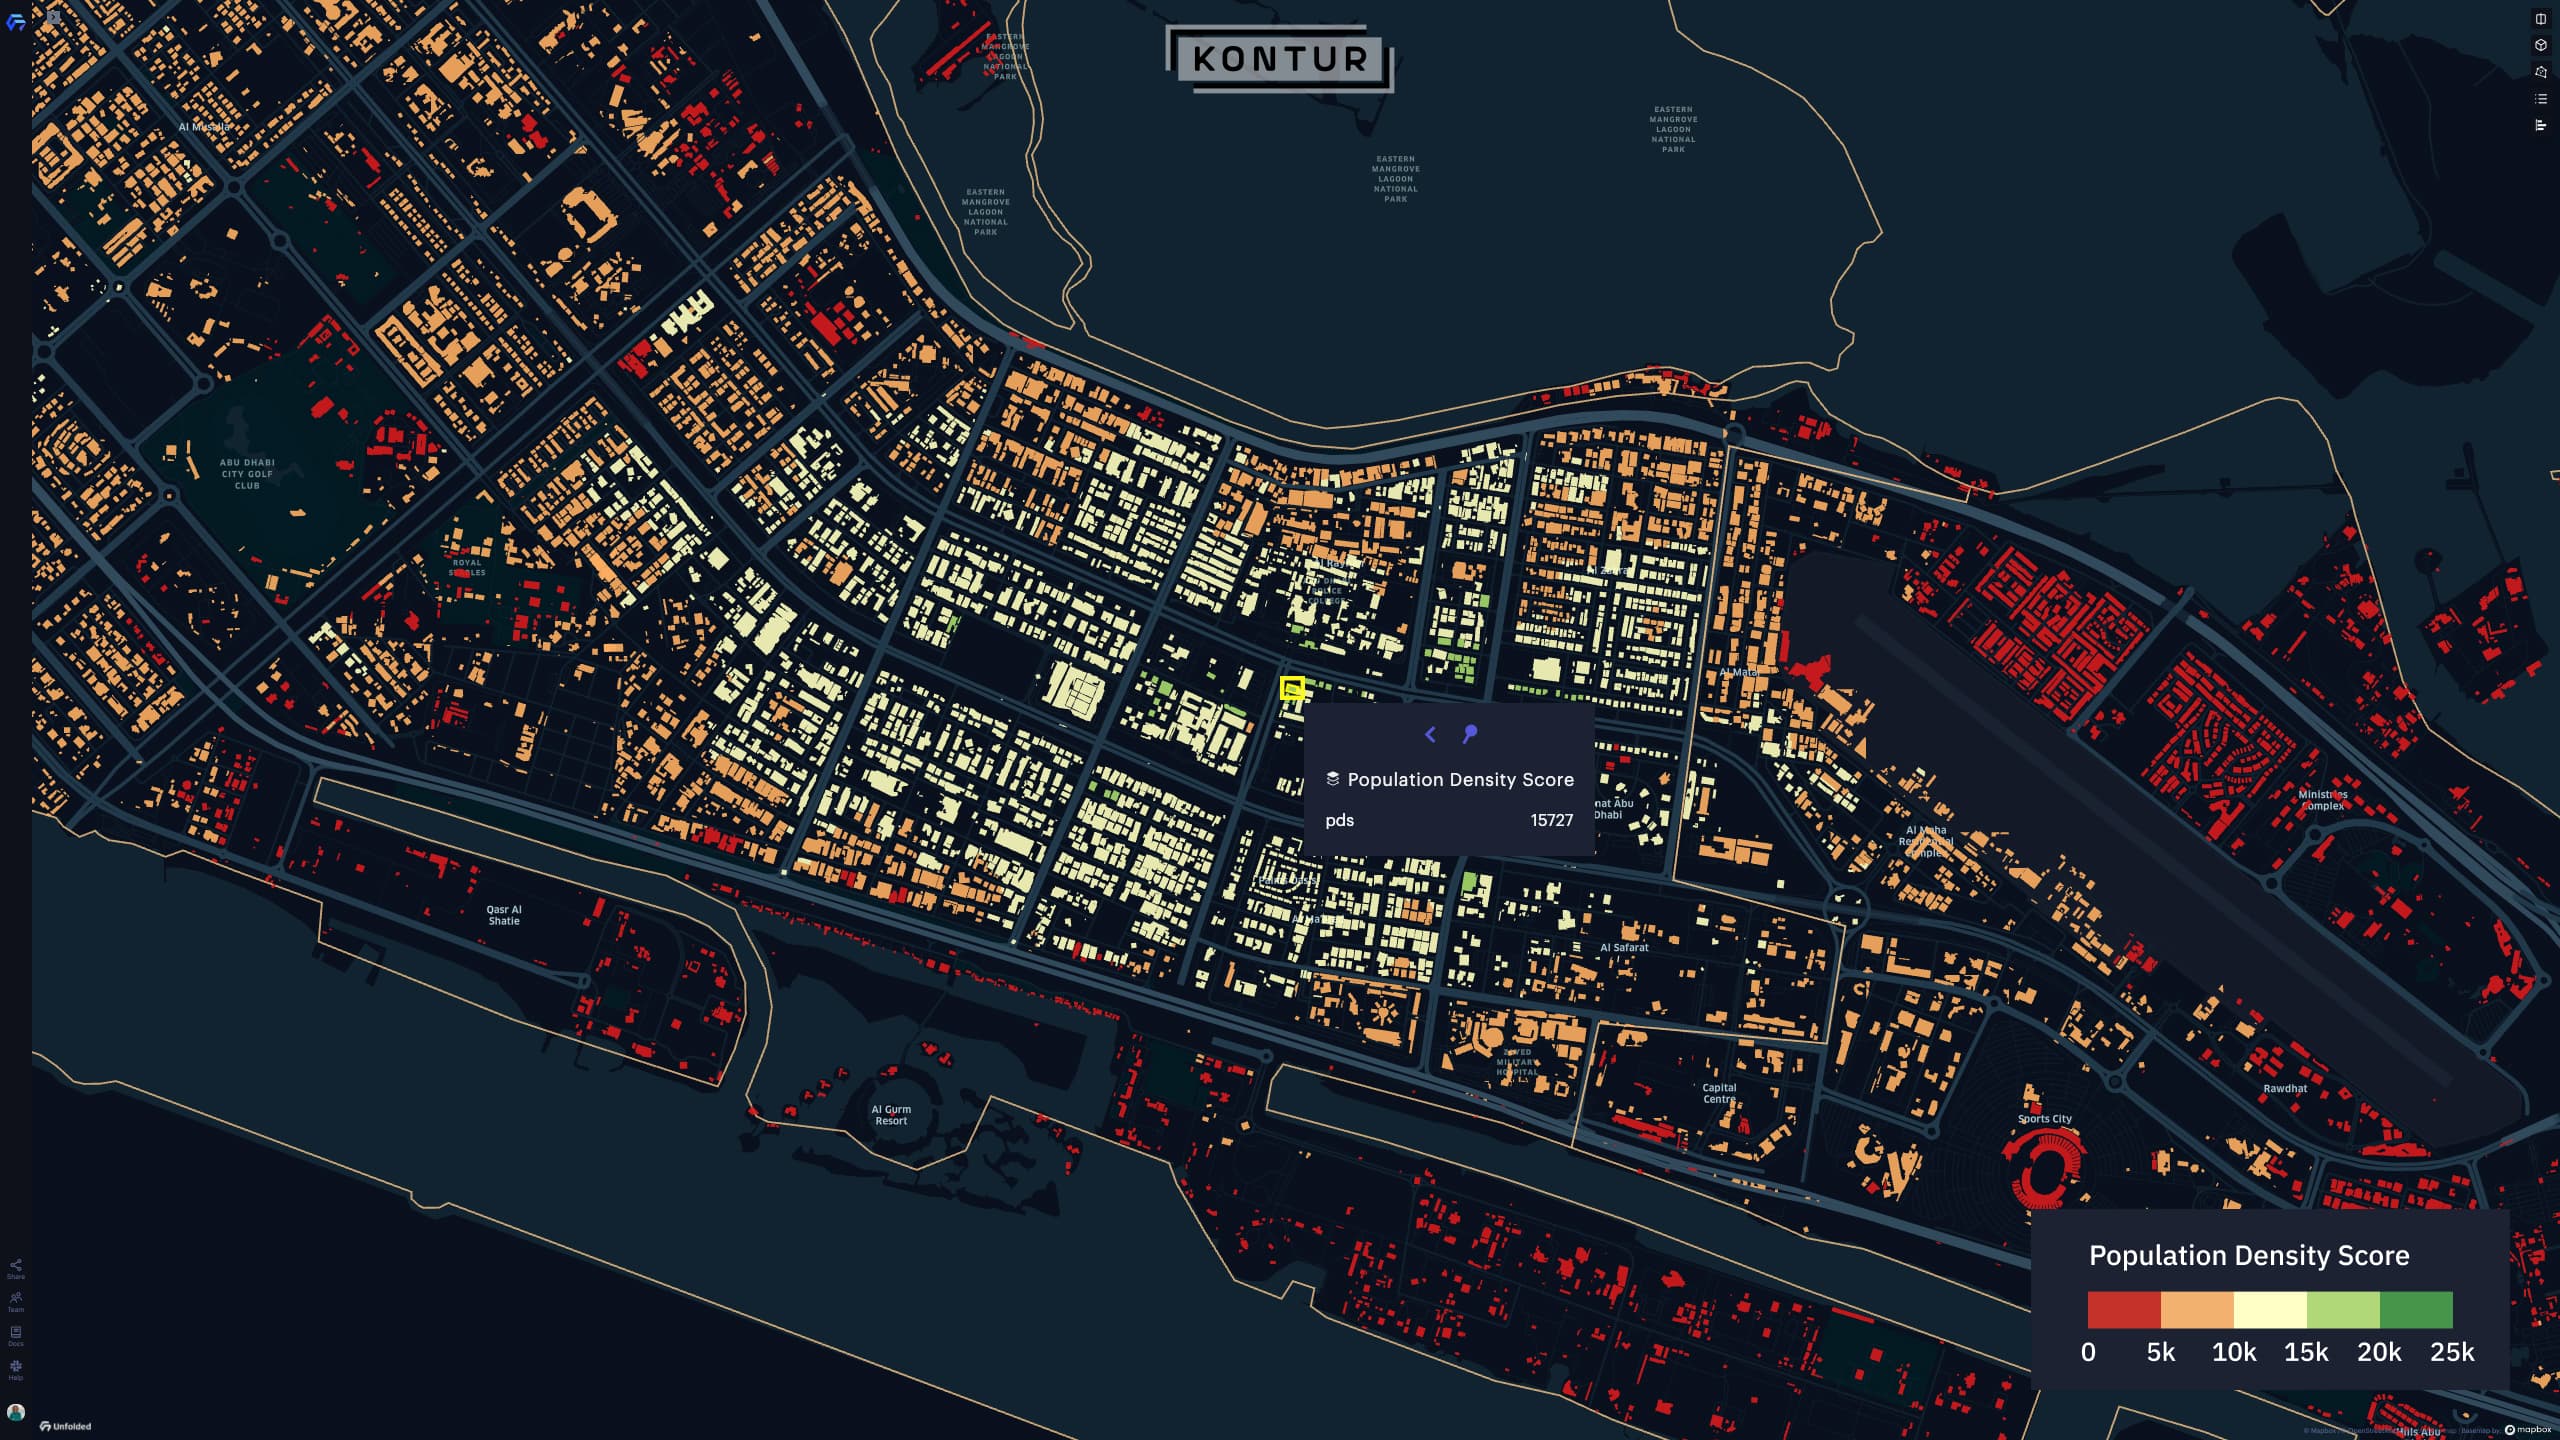
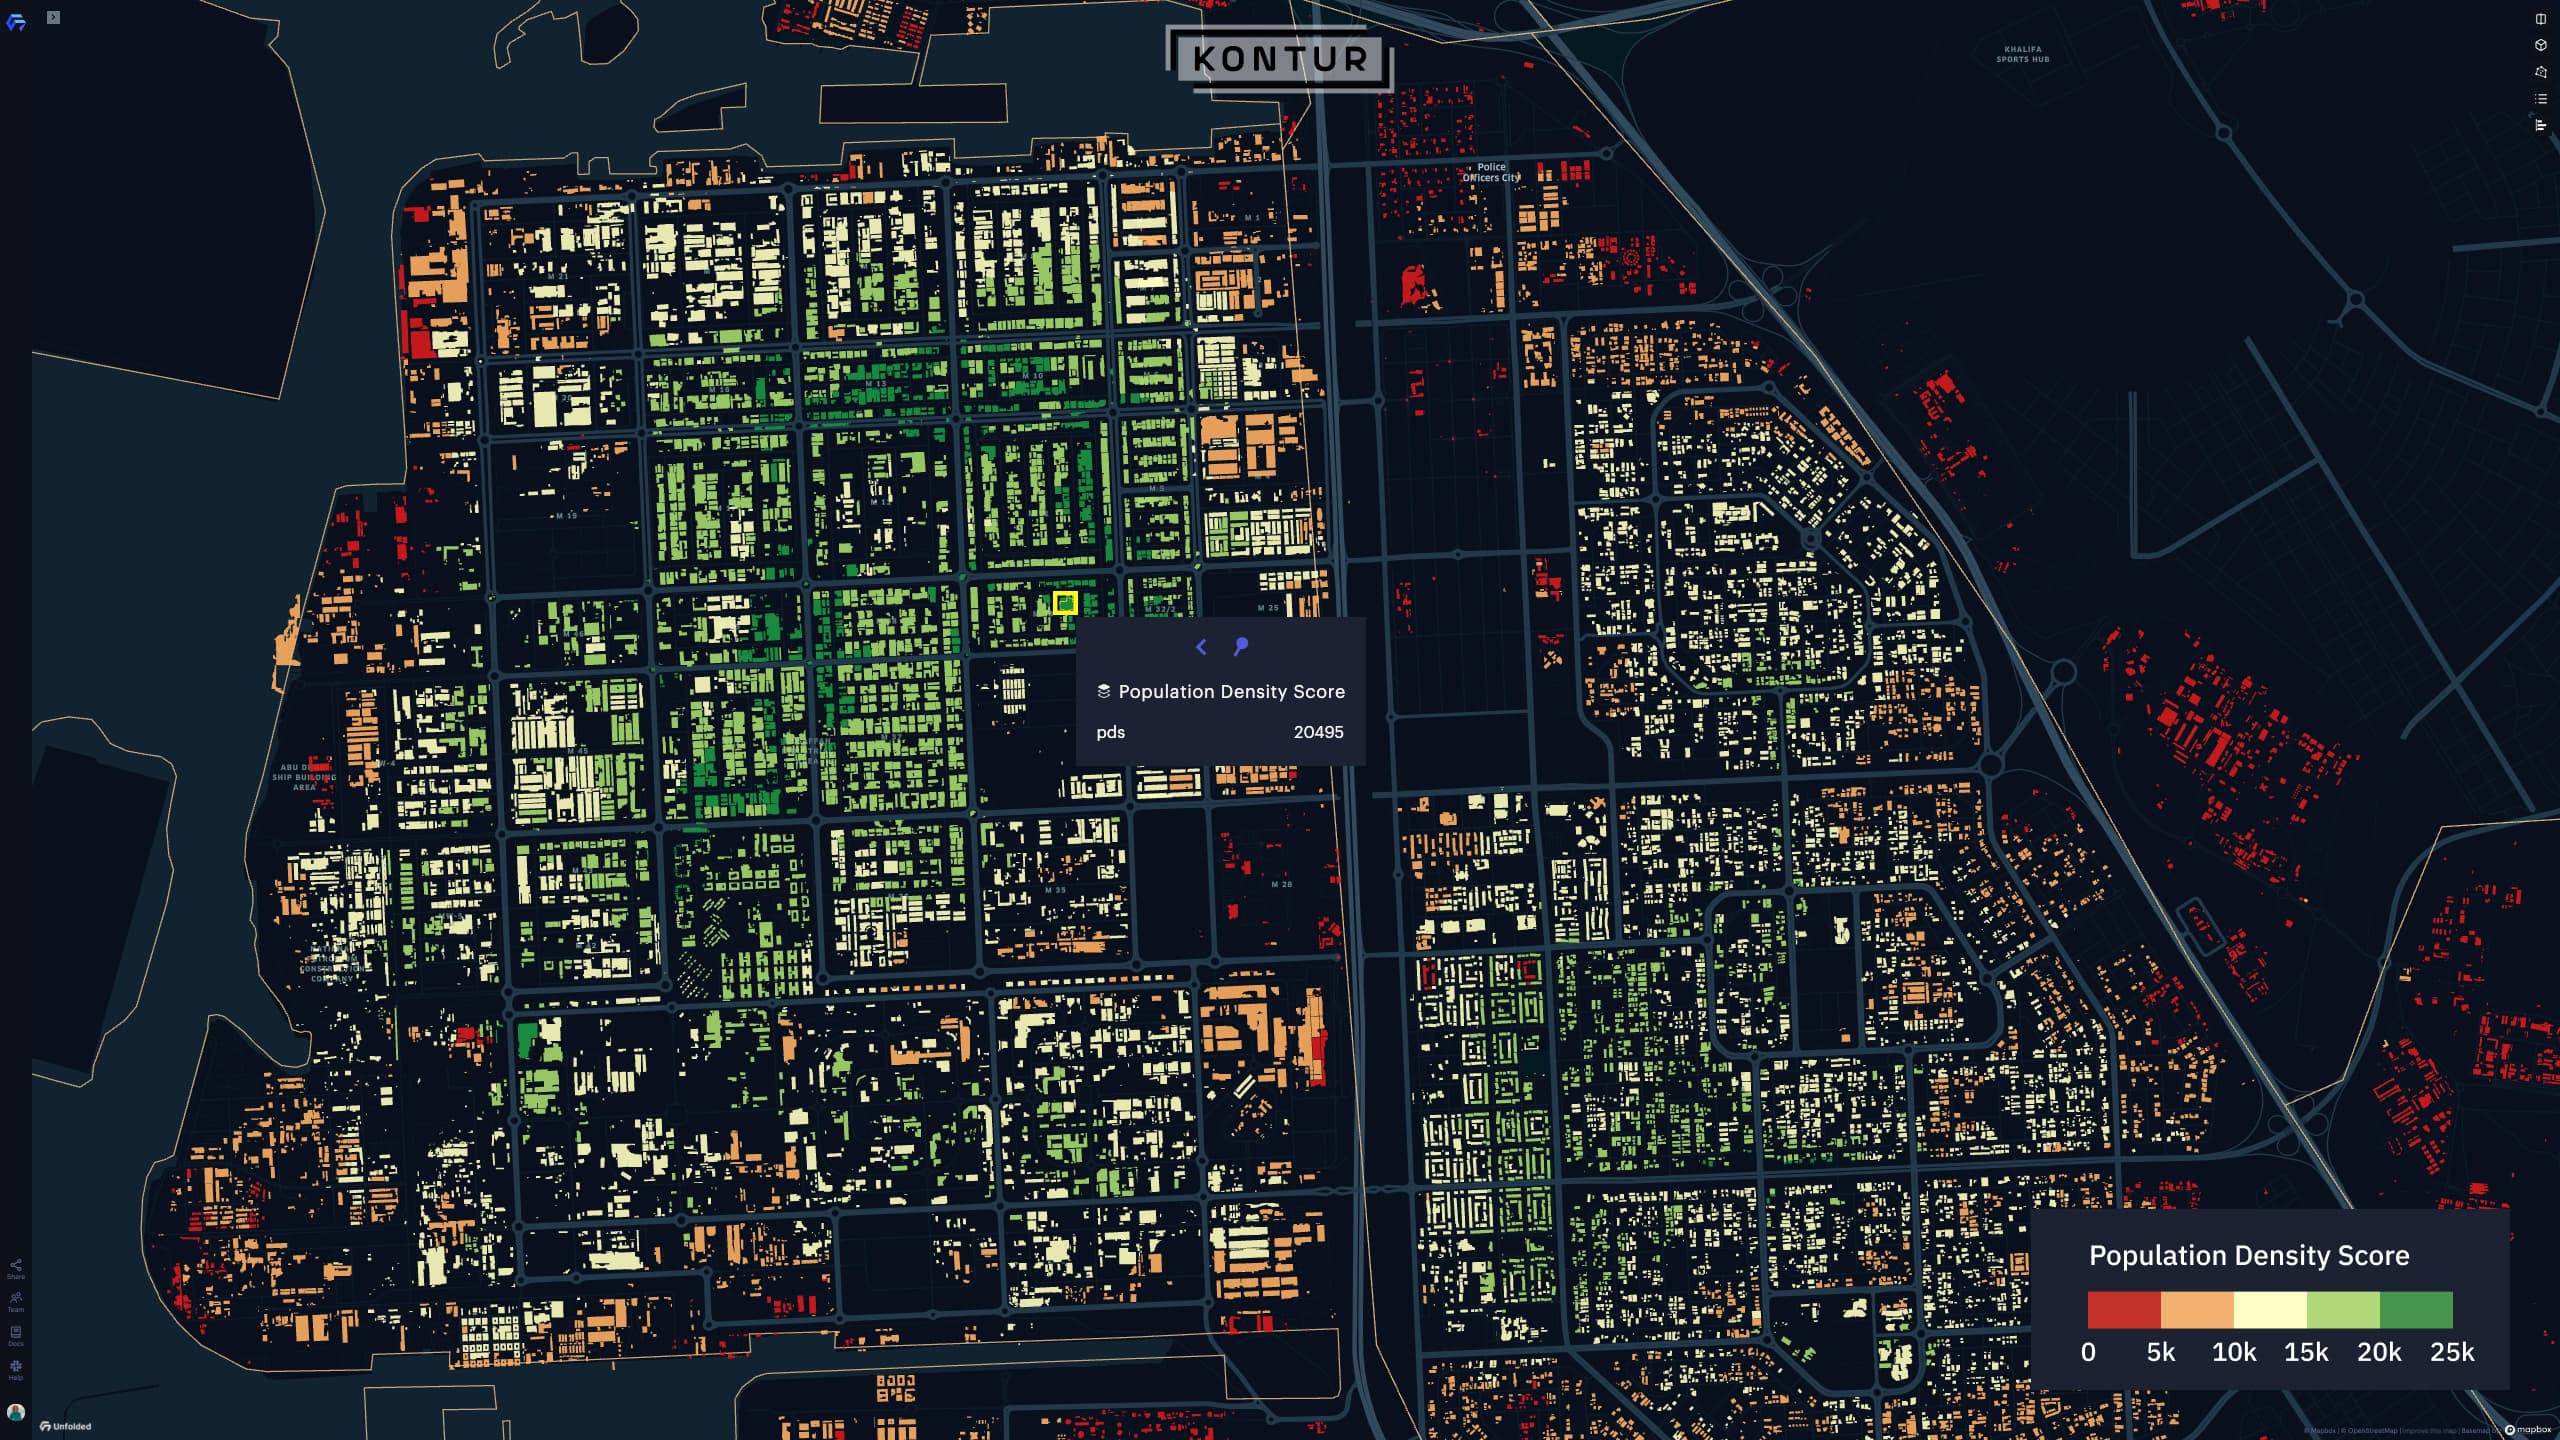
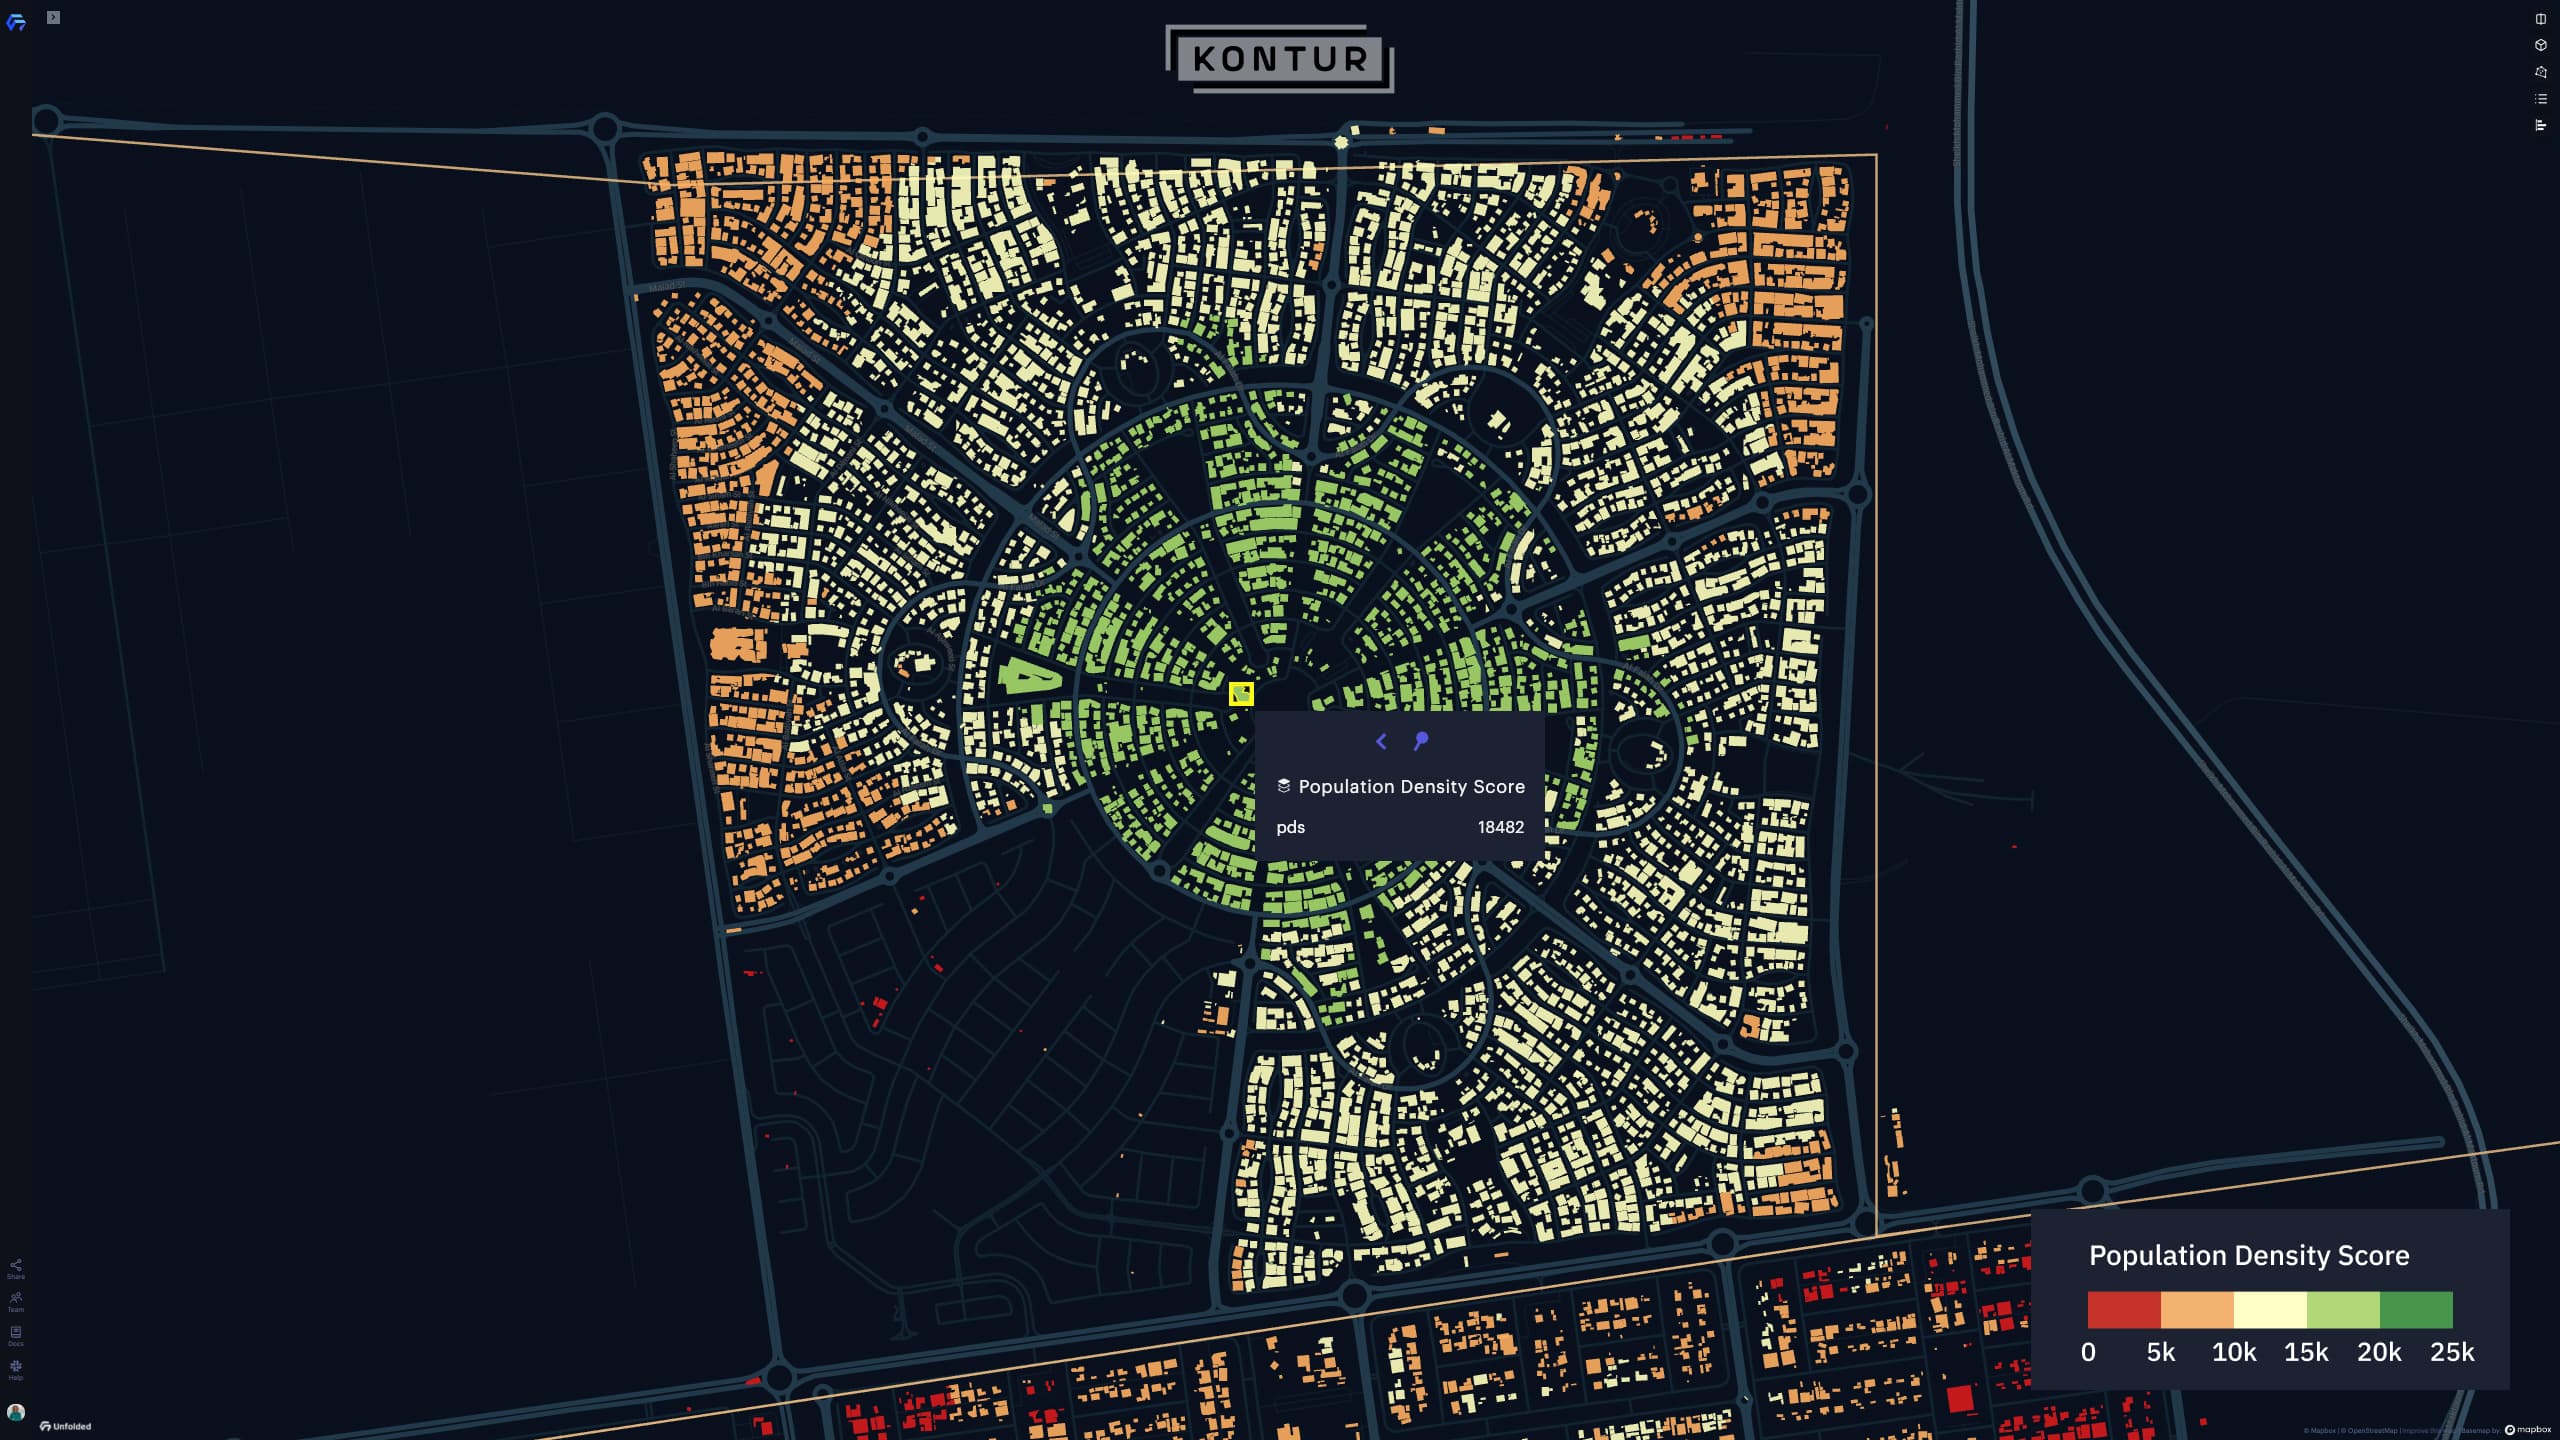
Another factor you should consider is the attainability of the restaurant. The more people live or work within walking distance, the more customers we can reach with delivery and hence better it is for the business. So let’s find out the Population Density Score for each building. This parameter shows the number of people we can reach within a certain delivery time from the restaurant.
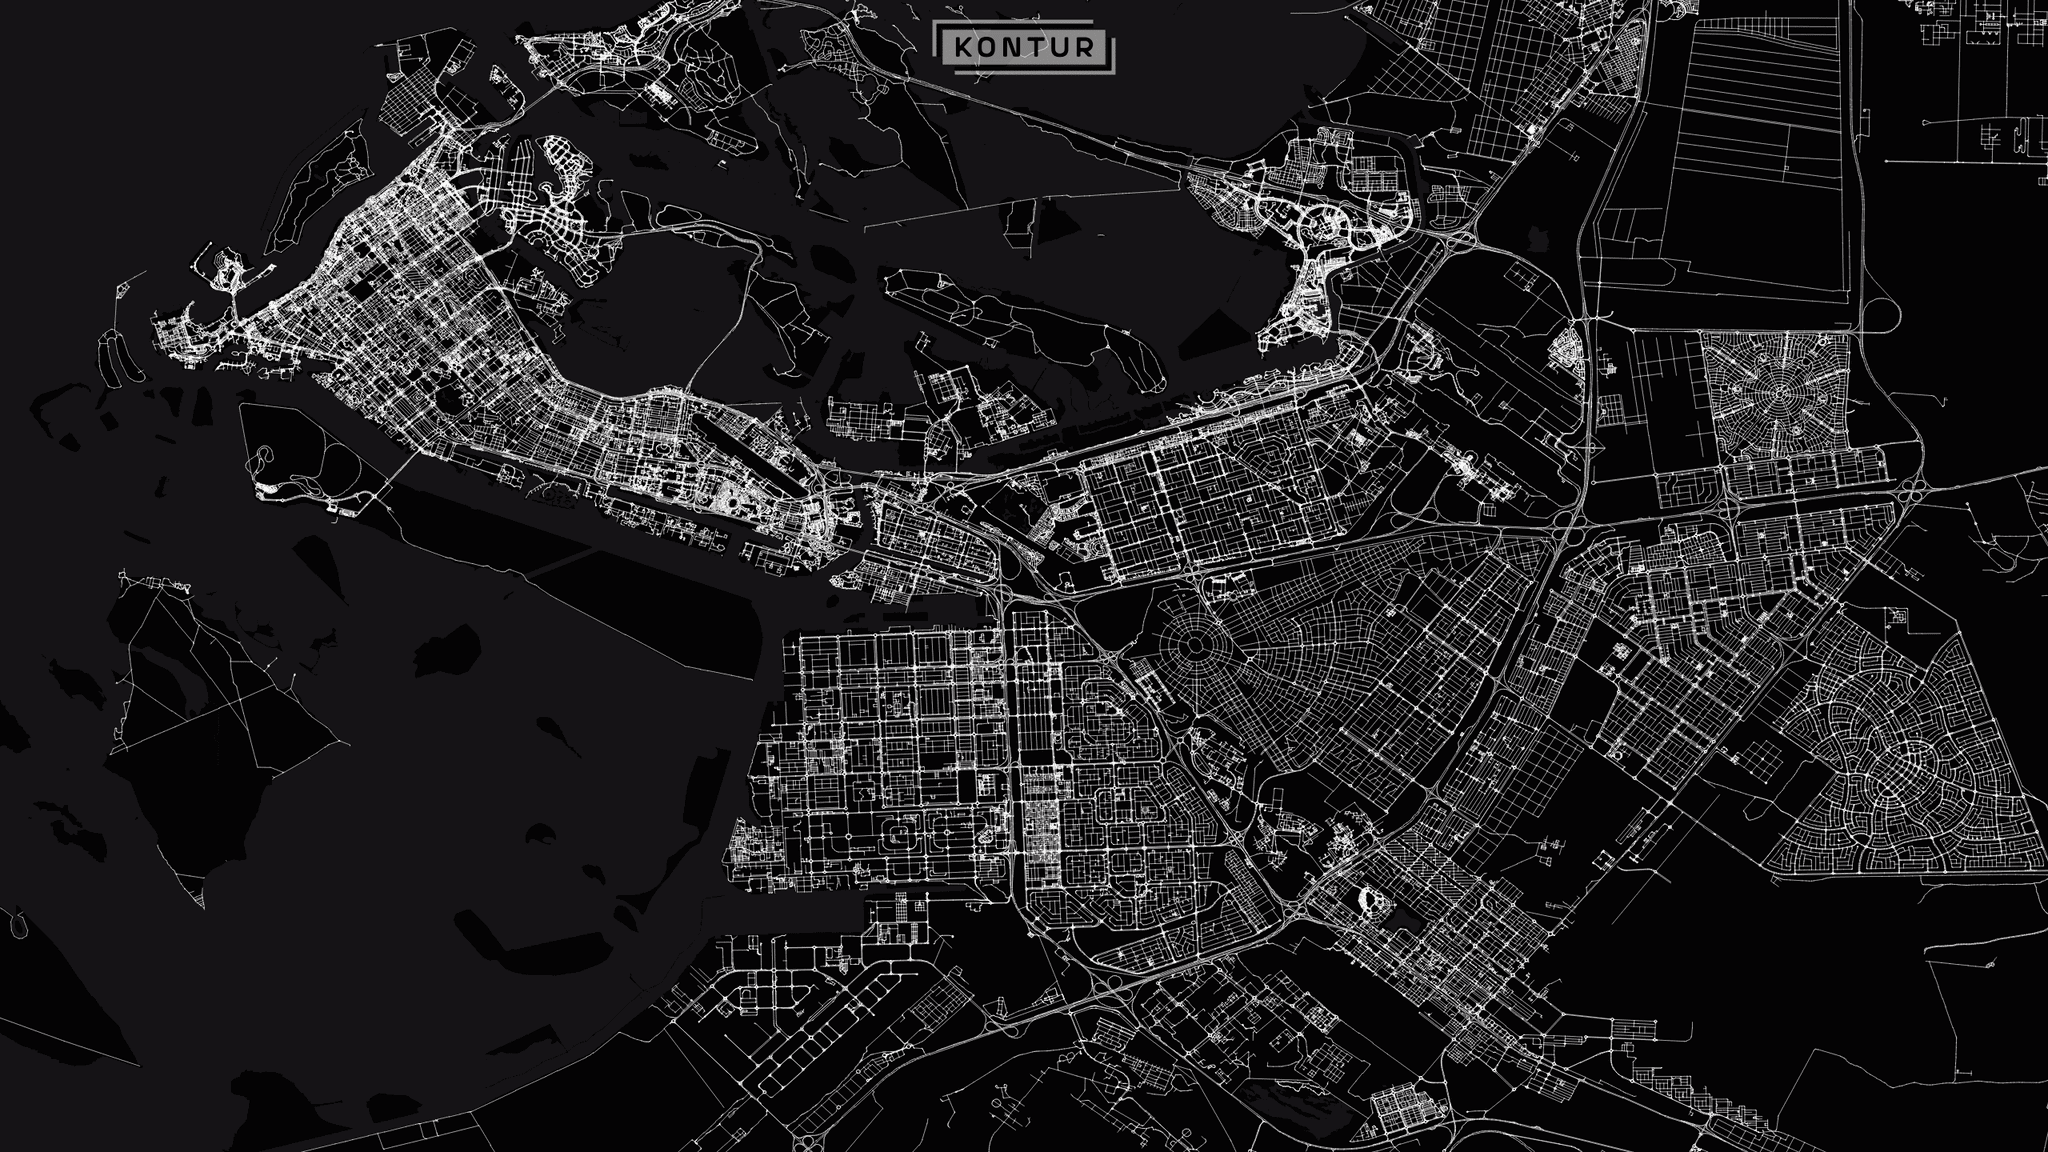
Let’s say you will use a bicycle delivery and you don’t want the rides to take longer than 10 minutes. First of all, we need to update the road segments in OpenStreetMap.
Some of them like the ones in newly built areas should be added manually:
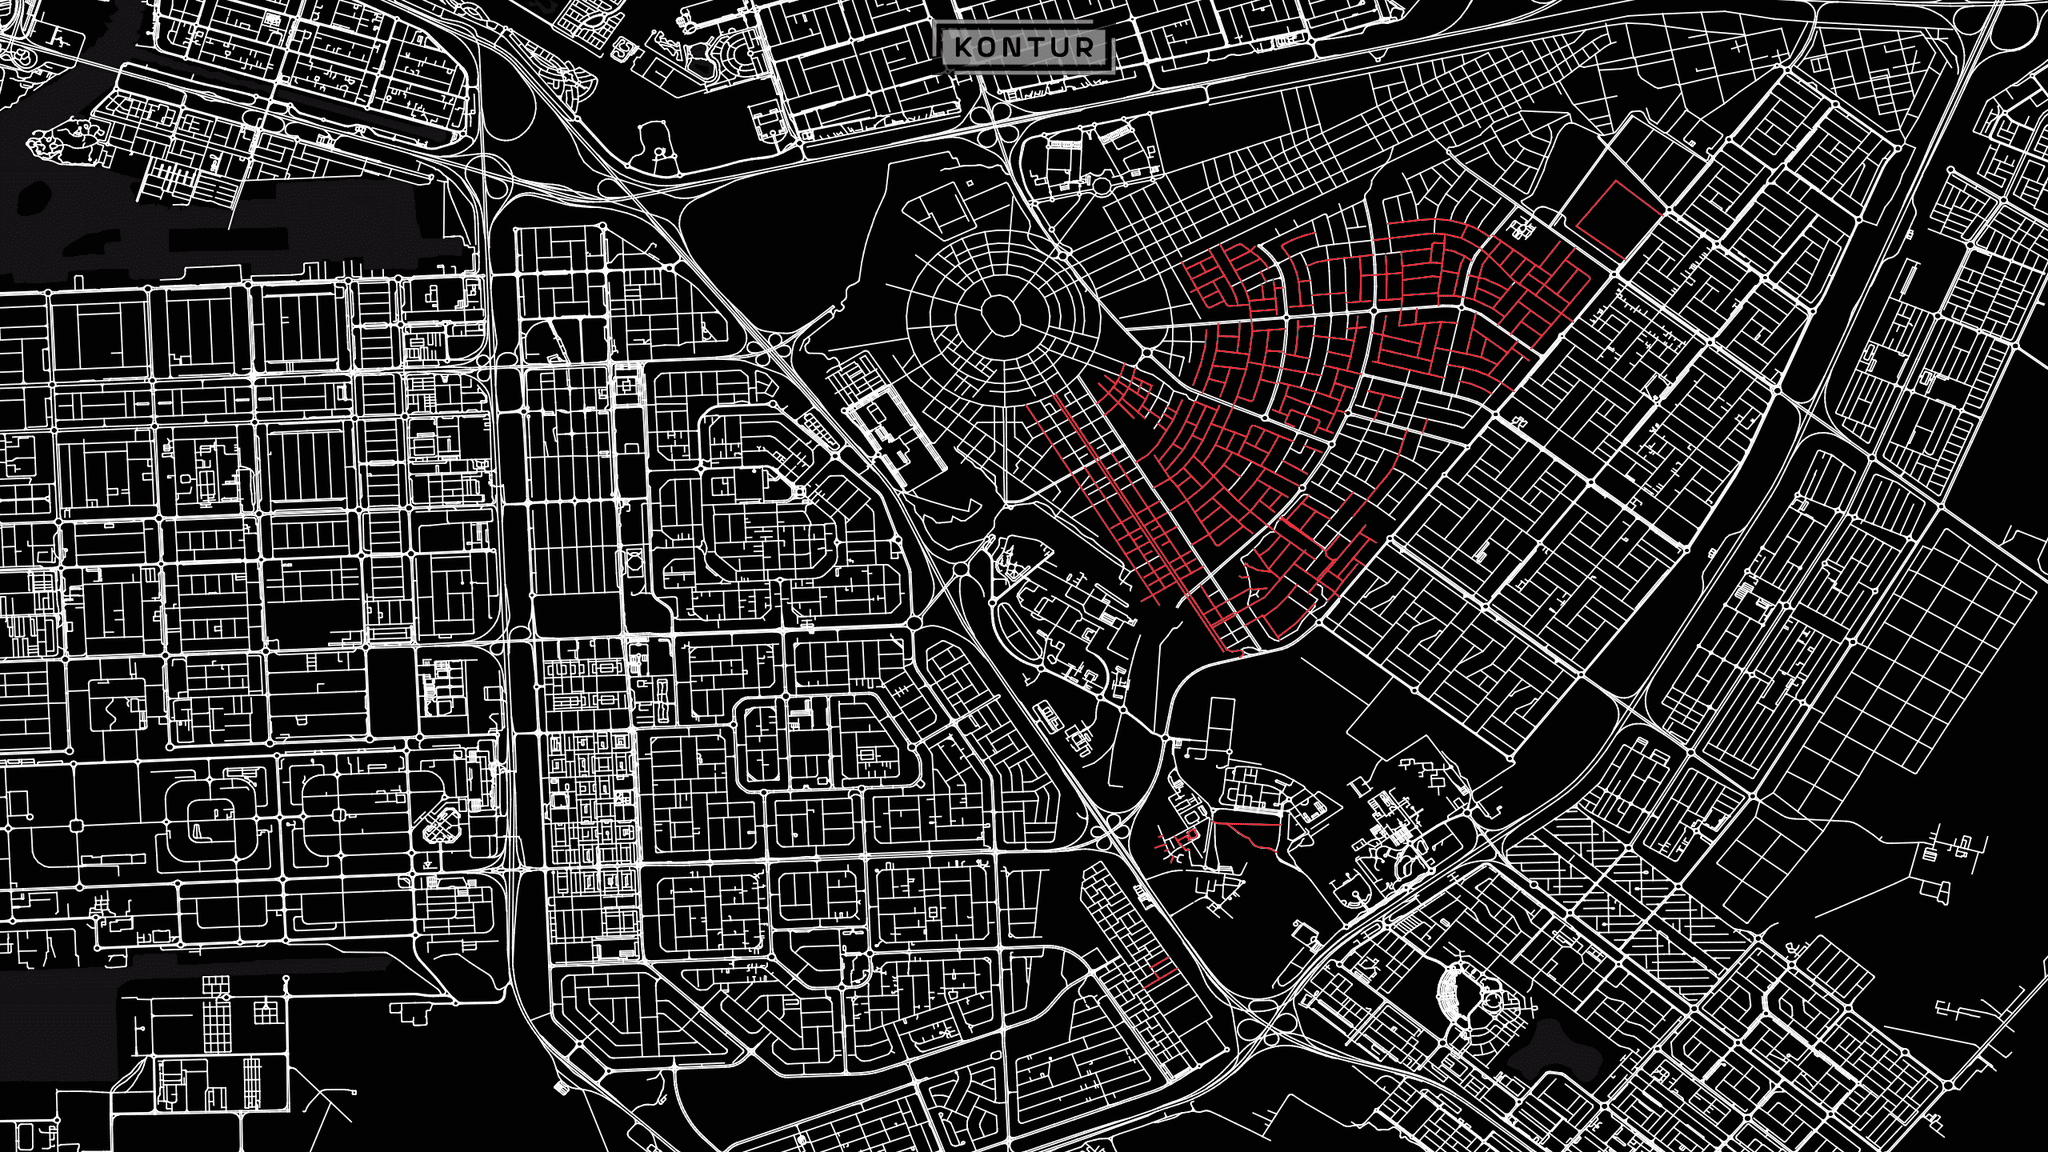
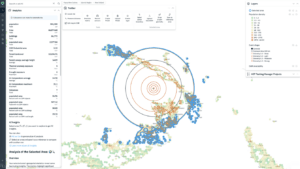
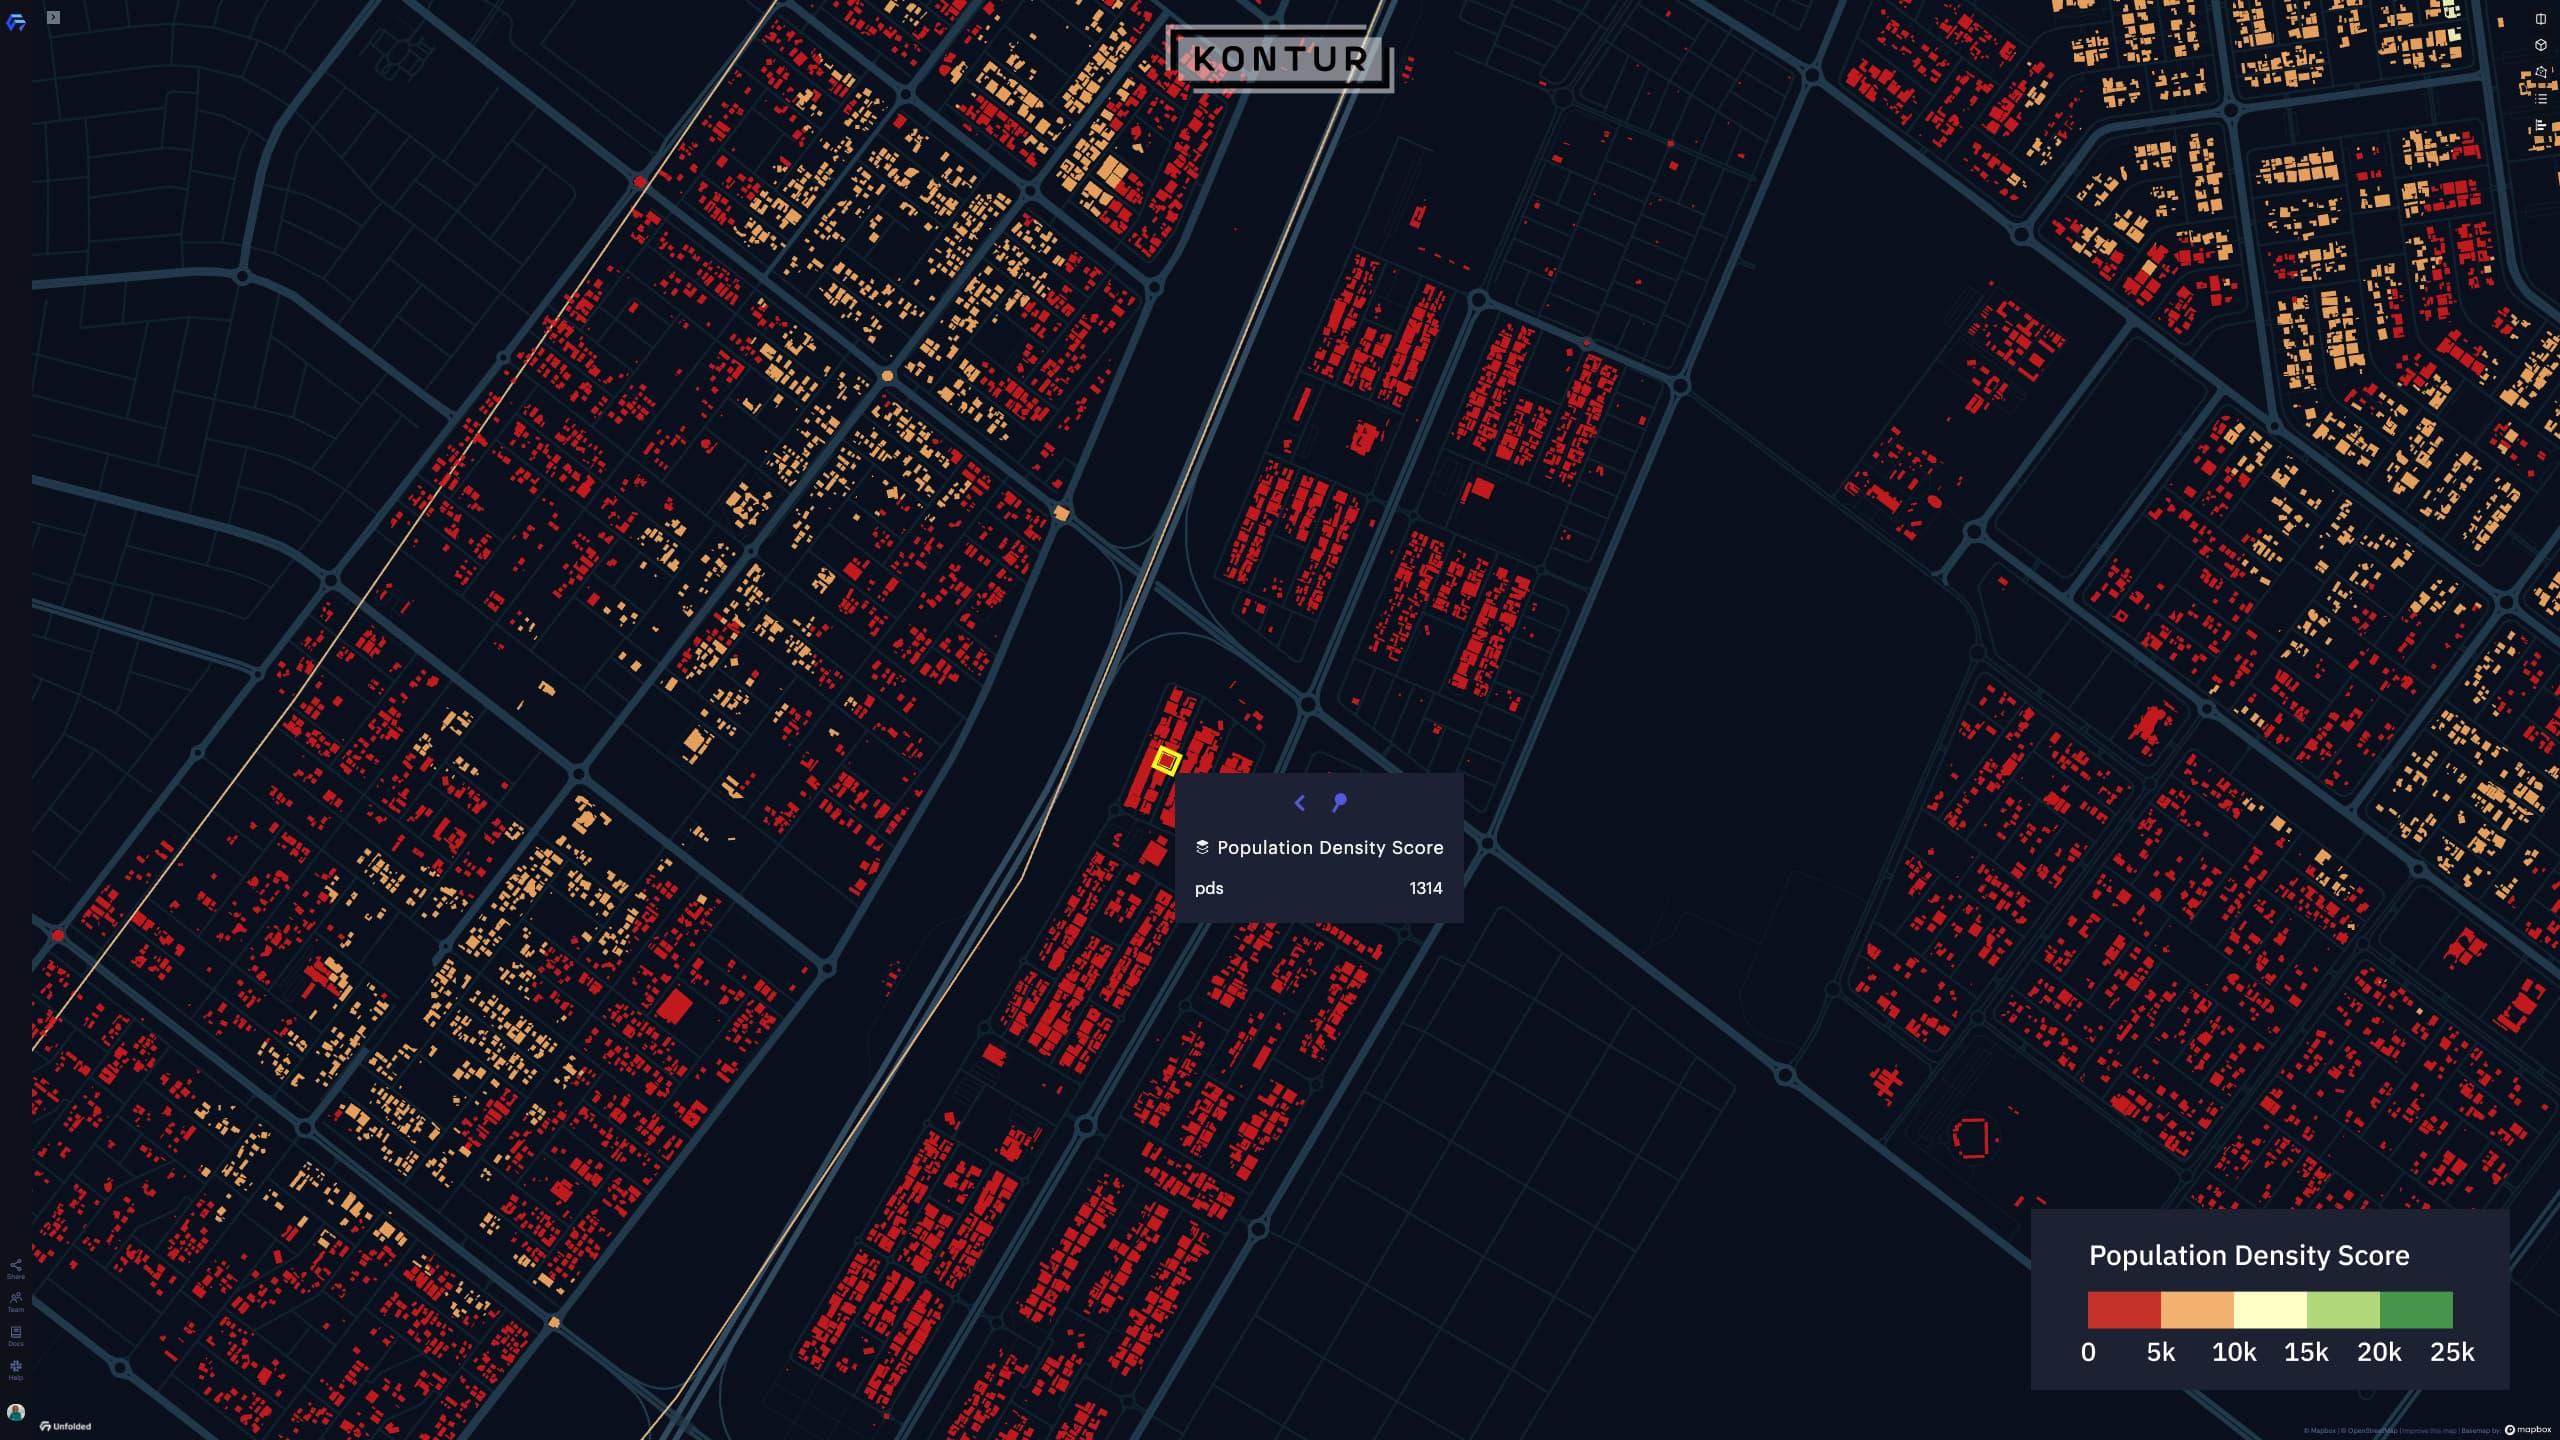
After that, we can set up the routing rules, set up a bicycle router, and build isochrones starting at each of 130,000 buildings:
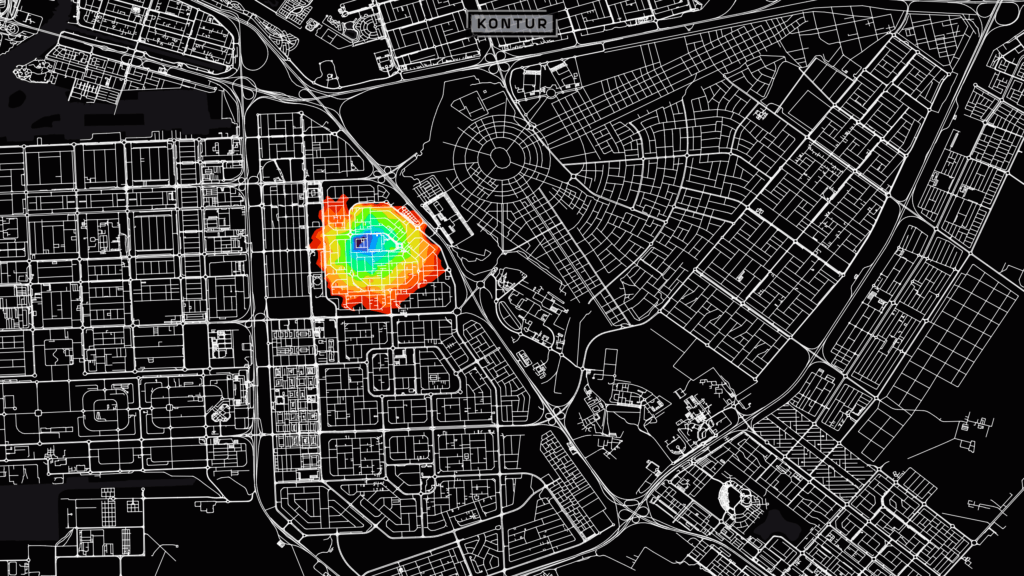
By calculating the population covered by isochrones, we get the Population Density Score for each building and can pick the ones with better potential:
Conclusion
Using geospatial data analysis significantly reduces the time it takes to find the best location when starting a new business. It also minimizes the hidden risks associated with the attainability for potential customers. Kontur technologies allow you to get meaningful insights with a minimum, and sometimes even no initial data. A similar technological approach can be applied to solve a wide range of logistics and business problems. Contact us if you need a geospatial solution to achieve your goal.